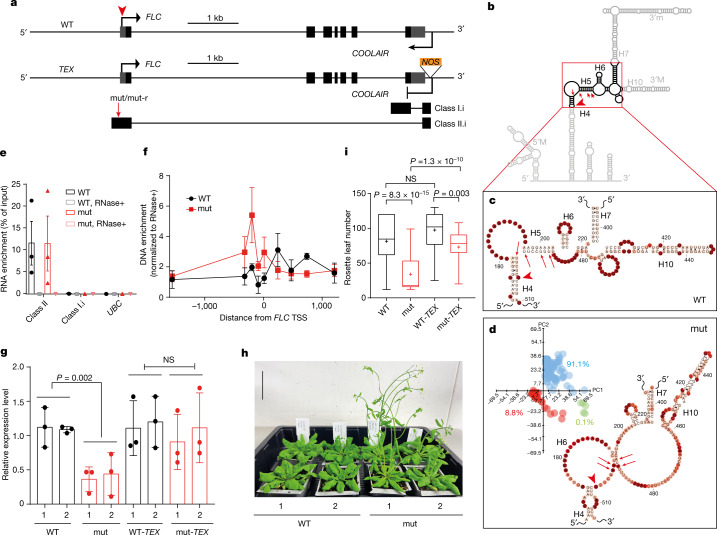
Fig. 4. COOLAIR structure-function analysis.
a, Schematic of FLC and COOLAIR in the wild-type (WT) and TEX transgenic lines. Grey boxes, untranslated regions; black boxes, exons. b, Schematic of the mutation in the major conformation, warm conformation 1 (Fig. 2a). c, The H4–H6 region of class II.i in the wild-type line from Fig. 2a. d, The H4–H6 region of class II.i in the mut line. Inset, DaVinci analysis of class II.i in warm-grown mut plants from around 300 individual mutational profiles. The mutation sites are indicated by red arrows in a–d. The red arrowheads indicate the sites corresponding to the FLC TSS in a–d. e, Enrichment of class II RNA by ChIRP–qPCR. Data are mean ± s.e.m.; n = 3 biologically independent experiments. Class I and UBC RNAs, negative controls. RNase+, RNase A/T1 mix was added during the hybridization. f, DNA enrichment at the FLC TSS region mediated by class II COOLAIR by ChIRP–qPCR. Data are mean ± s.e.m.; n = 3 biologically independent experiments. The zero indicates the FLC TSS. g, The relative expression level of unspliced FLC transcript by RT–qPCR in the indicated genotypes in warm conditions. Data are mean ± s.d., n = 3 biologically independent experiments. The 1 and 2 indicate independent transgenic lines. h, Flowering phenotype of wild-type and mut plants after cold exposure. Scale bar, 50 mm. i, Box plots showing the flowering time of the indicated transgenic plants grown in warm conditions measured by rosette leaf numbers. Centre lines show the median, box edges delineate the 25th and 75th percentiles, bars extend to the minimum and maximum values and crosses indicate the mean value. P values in g and i were calculated using a one-way ANOVA. For each genotype, populations of mixed T3 lines are analysed, from left to right, n = 36, 35, 36 and 36.

