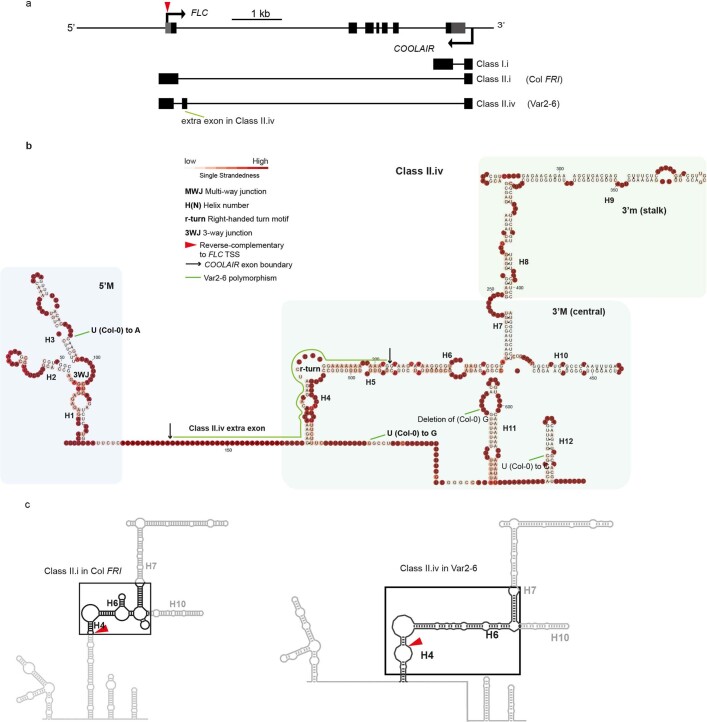
Extended Data Fig. 5. Natural variation increases the abundance of a structurally distinct COOLAIR isoform.
a, Schematic illustration of FLC and COOLAIR gene structure. Untranslated regions are shown in grey boxes and exons in black boxes. The extra exon of class II.iv in Var2–6 (ref. 7) is indicated by a green line. kb, kilobase. The red triangle indicates the site corresponding to the FLC TSS. b, In vivo structure of class II.iv in the Var2–6 line. c, The RNA structural model of warm conformation 1 is from Fig. 4b and Class II.iv from b. The hyper-variable regions are shown in the black square.

