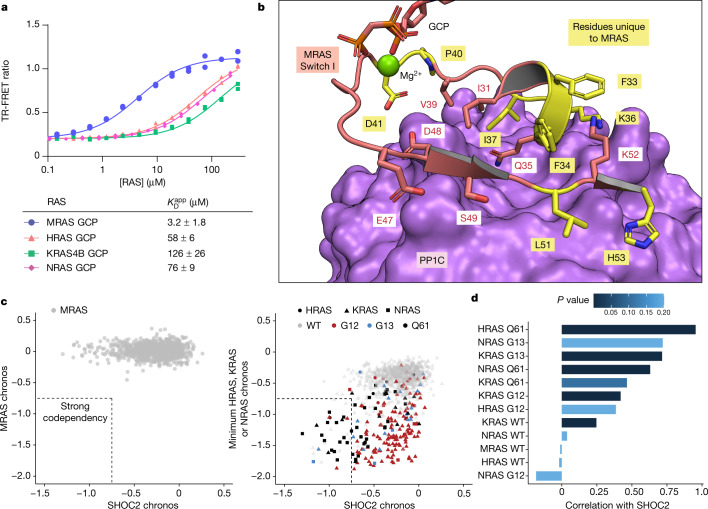
Fig. 3. Different RAS isoforms have a role in the SHOC2–PP1C complex.
a, Top, representative result of TR-FRET measuring association between PP1C and SHOC2 in the presence of varying RAS concentrations. Data represent two time points (n = 2). Bottom, table summarizing KDapp from two independently performed experiments (n = 2). MRAS(GCP) is the highest-affinity binding partner of SHOC2–PP1C among those tested. KDapp values (shown as mean ± s.d.) are a measure of relative affinity and depend on PP1C and SHOC2 concentrations. [PP1C] = 2 nM, [SHOC2] = 200 nM. b, MRAS switch I PP1C-contacting regions (salmon) bound to PP1C (purple). Residues unique to MRAS versus H/K/NRAS (yellow) make substantial contacts with PP1C. SHOC2 is omitted for clarity. c, DepMap chronos scores for 1,061 cancer cell lines (dots) for SHOC2 versus MRAS (left) or versus the minimum chronos score among H/K/NRAS (lowest score among each of the three possible RAS isoforms for each cell line), in which cell lines are identified by the RAS isoform with minimal chronos score (shape) and the hotspot mutational status of that isoform (colour) (right). Dashed lines encapsulate cell lines with strong co-dependency (chronos scores < −0.75). d, Pearson correlation coefficient (bars) and P-value from two-sided t-test (colour) calculated using DepMap chronos scores for SHOC2 versus HRAS, KRAS, NRAS or MRAS in which cell lines (n = 1,061) were grouped by hotspot mutational status of Ras isoforms.

