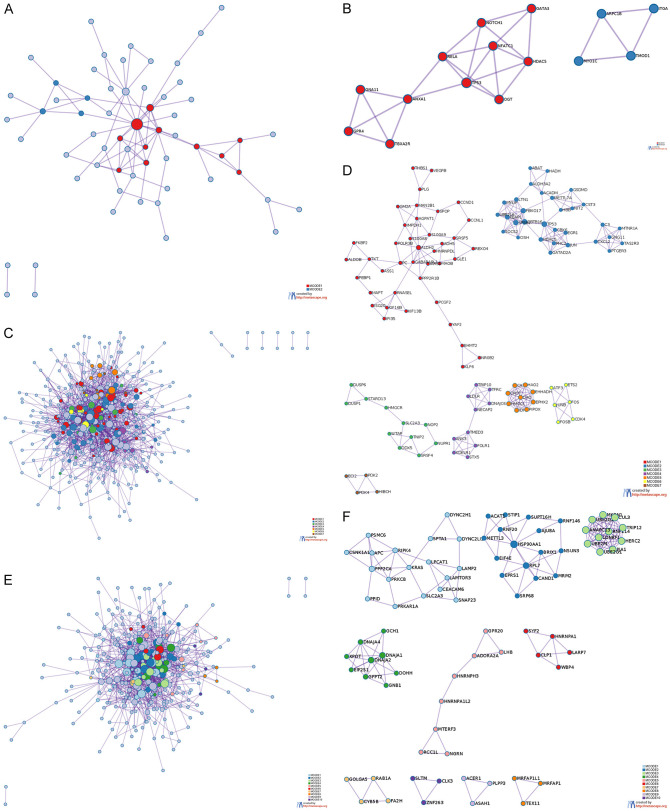
Figure 3.
PPI network diagram of DEGs in glomerular and tubular. Metascape was used to construct the spatial distribution characteristics of the macroscopic PPI network model of glomerular DEGs (A), renal tubule DEGs (C) and PBMCs DEGs (E). The clusters of glomerular DEGs (B), renal tubule DEGs (D) and PBMCs DEGs (F) were selected.

