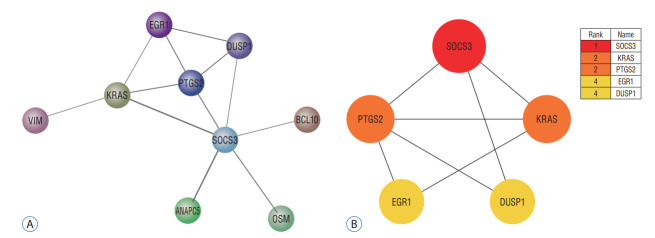
Fig. 6.
A : The protein interaction network of ischemic stroke-related differentially expressed genes. The edge between two nodes represented the gene-gene interaction. B : The protein interaction network of five pivotal genes. The node color represented the degree. Red represented the highest degree and yellow represented the lowest degree.

