Abstract
Objectives
To examine predictors of state-level COVID-19 vaccination rates during the first nine months of 2021.
Methods
Using publicly available data, we employ a robust, iteratively re-weighted least squares multivariable regression with state characteristics as the independent variables and vaccinations per capita as the outcome. We run this regression for each day between February 1 and September 21, the last day before vaccine booster rollout.
Results
We identify associations between vaccination rates and several state characteristics, including health expenditure, vaccine hesitancy, cost obstacles to care, Democratic voting, and elderly population share. We show that the determinants of vaccination rates have evolved: while supply-side factors were most clearly associated with early vaccination uptake, demand-side factors have become increasingly salient over time. We find that our results are generally robust to a range of alternative specifications.
Conclusions
Both supply and demand-side factors relate to vaccination coverage and the determinants of success have changed over time.
Policy Implications
Investing in health capacity may improve early vaccine distribution and administration, while overcoming vaccine hesitancy and cost obstacles to care may be crucial for later immunisation campaign stages.
1. Introduction
As vaccination efforts against COVID-19 unfolded across the globe, it became increasingly apparent that developing and authorising effective vaccines is only half the battle of achieving broad immunisation [1]. To a large extent, between-country differences can be explained by the disparate access to vaccine doses, as a small number of countries successfully secured agreements with manufacturers for large amounts of vaccines [2]. Still, diverging local trajectories within larger countries suggest that national supplies are just one component of a successful immunisation campaign. In the United States (US), certain states decidedly outpaced their neighbours in terms of per capita vaccinations despite proportional vaccine allocations.
While numerous studies have examined individual-level correlates of vaccine hesitancy [3], [4], very few ecological studies have analysed determinants of COVID-19 vaccination rates in the United States. Notable exceptions include studies by Brown et al. [5] and Stewart et al. [6], who found that US county-level vaccination rates as of May 2021 were associated with health system capacity and population density, as well as Lindemer et al. [7], who found that county uninsurance rates predicted vaccination coverage in early March 2021. However, there is a gap in the literature concerning analysis at the state level. Because state governments influence some of the most important policy levers under the American federal system, identifying state-level patterns may inform current and future vaccination campaigns.
Appendix A includes an overview of the delivery process from the point a vaccine leaves the manufacturer to the point it is administered to a patient . Since population immunity is ultimately the outcome of interest for vaccination campaigns, we focus on investigating the relationship between state-level vaccine administration rates and salient state characteristics. As the public health adage goes: “vaccines do not save lives, vaccinations do”.
1.1. Data
We utilise public state-level data on state characteristics and vaccination rates the first nine months of 2021; see appendix B for a full list of sources. The most notable drawback of our data is that data on health care expenditure are not available after 2014, posing a limitation to our analysis of that variable insofar as relative expenditure levels between states may have changed in the seven years since then. All other data used are from 2019 or later. We restrict the analysis to the 50 states given data limitations. However, in light of the historical disenfranchisement of non-state territories and entailing health disparities [8], further research would do well to shed light on vaccination outcomes in non-state US territories.
Our primary outcome is the number of vaccinations per capita (with the total state population as the denominator), without distinguishing between first and second doses. If, for example, a state has administered 1.0 vaccinations per capita, this could correspond to every resident having received one dose, half of the residents receiving two doses, or some other combination. While this per capita measure of vaccination uptake does not perfectly correspond to the eligible adult population at any point in time, it can more readily be compared to other variables that are similarly measured per capita. To highlight changes over time, we selected three points to analyse cross-sectional associations: February 1, June 1, and September 21; the latter date was chosen to restrict the analysis to the initial campaign for first and second doses, as the use of booster doses was authorised on September 22, 2021.
The selection of explanatory variables is based on a priori hypotheses as well as on findings in the existing literature [5], [6], [9], [3]. The variables included in the main model are a subset of all the variables we considered. As a rule, we include a variable in the main model if it meets one of the following three conditions: (1) it is independently associated with vaccination rates, (2) it appears to considerably confound the magnitude of the association between another variable and administration rates, as measured by how much its inclusion moves other coefficient estimates, or (3) it seems a priori to be important, such that even a null-result would be of interest. Exhibit 1 describes the variables included in the main model, while appendix B features an overview of all variables that were considered but not included in the final regression analysis.
Exhibit 1.
Variables in the main model.
We include healthcare expenditure (e.g., hospital care, physician services, and drugs but excluding public health) and public health expenditure (e.g., preventive programmes and information campaigns) as proxies of state health system capacity and infrastructure quality, which we hypothesise are important for facilitating the supply of vaccines [5], [6]. For demand-side factors, we include the measures of COVID-19 vaccine hesitancy and whether adults have not seen a physician due to cost obstacles. We include the share of the population in poverty to ensure that the cost obstacles variable captures a phenomenon relating to healthcare costs, specifically, rather than to poverty more broadly. Finally, we include population density [5], elderly population share [9], and political leanings as measured by the Democratic vote margin in the 2020 elections in net percentage points of the vote [3]. Exhibit 2 visualises the spatial distribution of the included state characteristics. Note that the scales and units of measurement differ across the different maps and each one should be carefully interpreted in its own context.
Exhibit 2.
Spatial distribution of select state characteristics.
1.2. Statistical analysis
In this ecological study, we use a robust, iteratively re-weighted least squares regression [10], where the dependent variable is vaccinations per capita for a state at a given point in time and the explanatory variables include state characteristics. Our main model does not include a measure of how many vaccines have been distributed to a state at a given point in time, as we consider vaccine distribution to be on the causal pathway to vaccine administration. In a sensitivity analysis, we further include a variable for vaccines distributed per capita at a given point in time.
To mitigate reverse causality, we consider only baseline state characteristics before the beginning of the immunisation campaign; for example, we utilise vaccine hesitancy as of January 2021. (It is worth noting that vaccine hesitancy is a dynamic phenomenon that may evolve over the course of an outbreak’s epidemic and endemic phases, and consequently should be interpreted in the specific context of when it was measured and analysed.) To demonstrate changing associations over time, we present results from rolling linear regressions in which the cumulative vaccinations per capita are measured at different points in time. Additionally, we examine the role of omitted variable bias [11]; and test robustness to dropping states one at a time as well as to an alternative definition of the outcome in the form of monthly, rather than cumulative, vaccination. See appendix C for the full model specification as well as model diagnostic tests focusing on heteroscedasticity, the distribution of residuals, and multicollinearity.
2. Limitations
Findings from any observational study should be interpreted with caution, particularly with respect to causal inference. While our robustness analysis based on Oster [11] suggests that selection on unobservables would have to be very severe to nullify most of our headline results, endogeneity remains an important limitation for our study. Moreover, given our focus on the state level, readers should avoid ecological fallacies – i.e., making inferences about individuals based on data aggregated data for a group – when interpreting the observed associations [12].
Our study did not account for state-specific policies influencing vaccine uptake. States differed considerably in how they prioritized vaccinations for certain populations, in their timelines for expanding vaccine eligibility, and in their incentive and information schemes to increase vaccine uptake [13], [14], [15]. These differences may have substantially influenced vaccination trajectories across states. However, our multivariable regression method is not well suited for analysing the effects of these policies due to being highly susceptible to endogeneity arising from bidirectional causality. For example, while a broad eligibility policy may increase vaccination coverage, a causal effect in the opposite direction is equally plausible, thus complicating the interpretation of any association between eligibility policies and vaccinations per capita. In theory, this issue can be mitigated by carefully linking policy changes to subsequent vaccination rates, for example by using a difference-in-differences framework. While we did not conduct such analysis here due to the multitudes and complexity of unique state policies, further research should examine the important role of policy in vaccination campaigns. Indeed, quantitative studies already indicate that such differences may have impacted vaccine uptake [14], [16]. Many of these differences between state policies, such as West Virginia’s use of local pharmacies to supply nursing and long-term care facilities, may be better explored qualitatively. Qualitative studies can also shed more nuanced light on idiosyncratic differences between states that precede the pandemic, for instance relating to distrust of the healthcare system and attitudes towards vaccination [17].
3. Study results
Main results
Exhibit 3 shows vaccinations administered per capita over time by state.
Exhibit 3.
Cumulative vaccinations per capita over time, 2021.
Vaccination rates varied considerably across states throughout the immunisation campaign and some states that did particularly well in the first months of the campaign have since lagged behind. For example, Massachusetts had the 16th fewest vaccinations by February 1 but the 2nd highest by September 21, while West Virginia ranked 2nd by February 1 but last by September 21. The diverging trajectories across states raise the questions: why did some states have higher vaccine uptake early on, and why did vaccination trends change over time?
Exhibit 4 reports results from three regressions aiming to shed light on these questions. As of early February, both healthcare and public health expenditure were positively associated with vaccination rates. The coefficient on healthcare expenditure implies that an increase of USD 10,000 in spending per capita was associated with 0.069 more vaccinations per capita; an increase of USD 100 in public health spending was associated with 0.18 more vaccinations per capita. These expenditure associations are more unclear in June and September. For public health expenditure, the data do not suggest an association in June (p = 0.238) or in September (p = 0.839). For healthcare expenditure, there is evidence for an association in both June (p = 0.051) and September (p = 0.046) and the β ^-coefficients were greater in both months, but the 99 %-confidence intervals include zero, suggesting greater variance in the relationship than in February.
Exhibit 4.
Correlates of cumulative vaccinations per capita.
The results from June 1 and September 21 reveal a negative association between vaccinations and the fraction of census respondents who said in January 2021 that they would "probably” or "definitely” not receive a COVID-19 vaccine. The coefficient from September implies that a 10 percentage point increase in vaccine hesitancy (as measured in January) was associated with a decrease in vaccinations of 0.14 per capita. Given that states differed by as much as 20 percentage points in the January poll – i.e., a predicted difference of 0.28 vaccinations per capita in September – and that states had administered an average of 1.13 vaccines per capita as of September 21, the magnitude of this association is of practical relevance. In June and September, there is also evidence for positive associations between vaccinations and the Democratic vote margin in the 2020 elections, as well as the share of the population above 65 years.
As of June 1, there was a negative association with the percentage of adults who in 2019 reported not having seen a doctor in the past year due to costs. However, there is no clear evidence for this relationship in February or September. Finally, neither population density nor the share of the adult population living in poverty are associated with vaccination coverage at any of the three points in time.
To better illustrate associations over time, we conducted the same multivariable linear regressions for cumulative vaccinations per capita for each of the 233 days from February 1 to September 21 and plot the coefficients from each of these 233 regressions. Exhibit 5 presents these rolling regression coefficients for select variables; appendix D includes plots for the remaining variables.
Exhibit 5.
Rolling regression coefficients of variables, February 1 to September 21.
For the variables on vaccine hesitancy and Democratic voting, the regressions show a clear trend in the association between the two factors at baseline and vaccination rates. Whereas the coefficients for both variables were close to zero between February and April, they have since steadily diverged from zero in opposite directions. As of September 21, the regression analysis suggests a strong positive association between 2020 Democratic vote margin and vaccinations per capita and a negative association for the share of state population that reported not wanting a COVID-19 vaccine as of January 2021. For public health expenditure, there was an association on February 1 that subsequently disappears but with a less clear trend. For the elderly population share, a positive association appears to increase in strength over time, though the 99 % confidence interval generally includes zero. For the remaining four independent variables, there was no clear trend over time.
Sensitivity analyses
Appendix E reports several sensitivity analyses supporting the overall robustness of our findings while shedding light on important nuances. First, several of the main findings are robust to using an alternative measure of vaccination in the form of new monthly, rather than cumulative, vaccinations per capita. However, the slowdown in vaccinations during the fall of 2021 makes it difficult to observe associations with new vaccinations in September. Second, when we include a time-varying measure for the number of vaccines distributed to each state on a given day, the positive associations with expenditure disappear, suggesting that the relationship between expenditure levels and vaccination rates could be driven by the ability of states to effectively distribute vaccines to administration sites. In contrast, the demand-side associations are generally robust to the inclusion of the distribution variable. Third, following Oster [11], we find that the results generally are unlikely to be explained by omitted variable bias, in the sense that it would require a very high degree of selection on unobservables to nullify our observed associations. We also find that adding a selection of potential confounding variables does not significantly change our main findings. Finally, we find that the observed associations are robust to dropping individual states from the regression.
4. Discussion
4.1. Interpreting the observed associations
Our findings show that the cumulative number of vaccinations administered per capita was positively associated with both public health- and healthcare expenditure early in the United States COVID-19 vaccination campaign. Although this association was hypothesised a priori, higher health expenditure is generally no guarantee of improved outcomes, as expenditure may also reflect higher morbidity, prices, or system inefficiencies. Consequently, the interpretation of these associations is limited by the fact that expenditure is only an imperfect proxy for health infrastructure quality.
Further analysis suggests that the association between expenditure and vaccine administration rates may operate through vaccine distribution. Expenditure is correlated with vaccine distribution, and the association between expenditure and administration disappears once distribution is included in the model (see appendix E). One causal interpretation of this pattern is that, at least around February, states with higher expenditure levels administered more vaccines primarily because they were more successful at establishing vaccination sites to which they could order the vaccine distributions required for doses to ultimately be administered.
While public health expenditure might seem like a better proxy for health system capacity with relevance for an epidemic immunisation campaign, regular healthcare capacity has also played a role in the COVID-19 immunisation campaign. In particular, hospitals and other inpatient clinics have been instrumental in implementing vaccination efforts within states, especially given the need for vaccines to be stored at ultra-low temperatures and administered by trained health professionals. In light of this, one interpretation of the data is that states with stronger healthcare infrastructure, in the form of well-funded and well-staffed hospitals and clinics, were better able to launch vaccination sites through which doses could be ordered, distributed, and administered.
It seems plausible that health system capacity plays a role in allowing states to distribute, and hence administer, larger volumes of vaccines. This hypothesis is consistent with findings from Davila-Payan and colleagues, who found that state-level vaccination rates during the 2009 A/H1N1 influenza epidemic in the US were positively associated health system factors, such as the number of vaccination sites [18], [19], and those of Brown et al. [5], who found that US county-level health system vulnerabilities were negatively associated with vaccination coverage as of May 25. Similarly, a systemic review by Brien et al. [20] identified education status and previous influenza vaccination among individual-level predictors of A/H1N1 vaccination status in twelve countries, while Archibong and colleagues find that state-level vaccination rates in Nigeria are associated with health infrastructure quality [21].
The results from June and September suggest a clear negative association between vaccine hesitancy and vaccinations per capita. Our robustness analyses imply that this relationship is not driven by any individual states. Having established this association empirically, the question for policymakers, then, is what are the causes of vaccine hesitancy itself? There is a burgeoning literature dedicated to the determinants of vaccine attitudes [22], and recent research is shedding light on the phenomenon in the context of COVID-19 [4], [3].
As of June 1 – but not in February or September –, cost obstacles to care appear negatively associated with cumulative vaccinations. This result corroborates similar previously reported associations observed in the context of 2009 pandemic H1N1 vaccination coverage [18], [9], as well as studies highlighting socioeconomic vulnerabilities as determinants of US county-level COVID-19 vaccination coverage as of May 2021 [5], [6]. While this result may appear puzzling considering that the COVID-19 vaccine is offered free of charge to anyone in the US, there are several potential explanations. First, many individuals do not know, or refuse to believe, that the vaccine is truly administered free of charge. One April 2021 poll found that 32 % of unvaccinated respondents cited concerns about having to pay out-of-pocket costs among their reasons for not having received the vaccine yet [23]. While this concern may be factually unwarranted given that vaccines nominally have been freely available, it is neither surprising nor irrational in a health system where out-of-pocket expenses can be financially ruinous and difficult to anticipate. For instance, some patients have been met with surprise bills for thousands of dollars for COVID-19 diagnostic tests that were supposed to be freely available under federal law [24]. The fact that some vaccination providers ask patients to bring their insurance card, as well as isolated incidents of patients being mistakenly billed, have contributed to widespread confusion about the true costs of vaccination [25]. The people who have not seen a doctor for at least a year due to costs are also more likely to be generally disconnected from the health system and thus unaware that the vaccines are freely available.
Another explanation for why a high prevalence of cost obstacles to care predicts state-level vaccination rates is found with the indirect financial costs associated with vaccination. In the same poll cited above, 15 % of respondents mentioned difficulties around transportation to a vaccination site among the reasons for not being vaccinated yet and 20 % voiced concerns about having to take time off from work to go and receive the vaccine [23]. That these concerns were more common among black and hispanic than among white respondents is yet another piece of evidence shedding light on racial and ethnic vaccine inequity in the US [26]. Moreover, each of the COVID-19 vaccines is associated with mild-to-moderate side effects that may interfere with work. Another poll from June 2021 found that workers were more likely to be vaccinated if their employers provided paid time off to get vaccinated and recover from side-effects, or simply encouraged vaccination [27]. These results highlight that demand-side barriers to vaccination are far more complex than mere hesitancy concerning the vaccine. To support vaccine uptake, governments should consider providing additional information and financial support to those who are the most marginalised by the healthcare system.
In both June and September, there is clear evidence of a positive association between cumulative vaccinations per capita and the Democratic vote margin in the 2020 US elections. One interpretation of this association is that Democratic voting is related to demand-side factors such as vaccine attitudes; initial evidence strongly suggests that vaccine uptake is greater among Democratic voters [3]. Despite vaccine hesitancy already being in the model as a separate variable, there are two reasons this could still explain the association. First, the hesitancy variable was selected as a measure of attitudes before any potential influence by the outcomes of the immunisation campaign. Vaccine attitudes have evolved in the months since January 2021 [23], and it seems plausible that this development followed partisan lines, As such Democratic voting could explain variation in the demand for vaccines that was not captured in the early January poll. Second, the sample-based census poll may be an imperfect measure of vaccination attitudes. If so, the Democratic voting variable could be capturing variation in vaccination attitudes that was imperfectly measured by the hesitancy variable.
The June 1 and September 21 results suggest a positive association between vaccinations per capita and the population share above 65 years, which is unsurprising considering the increased vulnerability to COVID-19 among the elderly. However, it is worth noting that the relationship is among the identified associations that is the most heavily influenced by dropping individual states, particularly those with especially young (e.g., Alaska) or old (e.g., Maine) populations (see appendix E). It should also be recognised that the elderly population faces distinct challenges to accessing vaccines, such as mobility difficulties, and that even maintaining high vaccination rates in the most vulnerable age groups often requires targeted efforts [28].
4.2. Evolving determinants of state-level vaccination rates
One of the more striking patterns revealed by this analysis is that the determinants of state-level COVID-19 vaccination rates have evolved over time. As Exhibit 4 shows, some variables had a clear relationship with the outcome in February but less so or not at all in September, and vice versa for other variables. By plotting the rolling coefficients from 233 regressions between February 1 and September 21, we visualise the evolution of each determinant (Exhibit 5 and appendix D). The clearest pattern is that the associations between vaccination outcomes and vaccine hesitancy, as well as Democratic vote margin, have grown stronger over time. It also appears that the association for public health expenditure has gotten weaker, though this trend is noisier.
Together, these results support a compelling narrative about the trajectory of the vaccination campaign. Early on while vaccine eligibility was limited, demand-side factors such as vaccine hesitancy and (perceived) cost obstacles to care were not strong determinants of outcomes, as vaccinations were limited by both manufacturing capacity and the ability of states to distribute allocated doses. Consequently, supply-side dimensions of health system capacity, as proxied by expenditure, were better predictors of state-level immunisation success. States like Alaska and West Virginia, which have some of the highest per capita (public) health expenditures, were able to distribute vaccines well and achieved the highest vaccination rates around February and March. However, as supply constraints were gradually relaxed and states depleted the pool of the most willing vaccinees and expanded their eligibility policies, population demand mattered more. As of April, differences in vaccine hesitancy became increasingly predictive of vaccination outcomes. Further, since vaccine attitudes are markedly partisan, the greater role of demand allowed for a divergence along party lines. Alaska and West Virginia, the two Republican states that had vaccinated at the fastest rates in February, started lagging. As of September, 22 of the 25 states with the fewest vaccinations per capita had voted Republican in 2020. The fact that this pattern only arose several months into the vaccination campaign suggests that it is differences in population demand, not state ability to supply, that explain the partisan divergence in immunisation outcomes.
Beyond policy implications, this pattern of results can inform methodology for future research on immunisation campaigns during public health emergencies. Most research on epidemic vaccination rates analyse determinants of coverage at a single point in time, typically several months into the campaign [5], [6], [18], [19]. Such analyses can be misleading for infectious disease outbreaks where both the nature of the epidemic and the vaccination effort change rapidly over time. Researchers should consider utilising time-series data for a more comprehensive analysis.
5. Conclusion
In this examination of the United States pandemic vaccination campaign, we have provided evidence for the critical role of both supply-side factors, such as healthcare- and public health infrastructure, and demand-side factors, such as vaccination attitudes and cost obstacles to care. We have shown that the determinants of COVID-19 vaccine administration have evolved over time. In particular, we have provided evidence consistent with the idea that while supply-side factors initially constrained immunisation efforts, the demand for vaccines ultimately has become the differentiating factor between states with low and high vaccination coverage.
While this study has limitations, particularly when it comes to causal interpretation, the findings presented here suggest clear policy implications. For one thing, the results may inform the COVID-19 vaccination campaigns in the United States, including the administration of booster doses. The clear partisan picture that emerges even after adjusting for vaccine hesitancy suggests a crucial role for political messaging in regions where coverage remains limited. Moreover, the apparent role of cost obstacles to care underscores the need for greater efforts to increase information and access for marginalised communities.
While certain factors undoubtedly are limited to the United States, some aspects of this analysis may be instructive for other countries undertaking vaccination efforts, particularly as they seek to bolster population immunity in the face of seasonal forcing and emerging viral variants [27], [28], [29], [30]. The analysis also holds policy lessons for preparedness efforts before the next pandemic: investing in (public) health infrastructure and proactively working to improve vaccine uptake can pay dividends for future epidemic vaccination campaigns, in addition to any health gains that can be realised immediately.
Finally, while states are often ranked by the speed at which they achieve vaccination coverage, it must be stressed that vaccination rates alone are not the sole indicator of a successful vaccination campaign. Measures like vaccinations per capita do not reveal information about other fundamental objectives of public health, such as protecting at-risk populations and promoting health equity [31], [32]. Indeed, highlighting crude vaccination rates can potentially have the adverse consequence of incentivising policymakers to prioritise speed above all other outcomes. Consequently, it is vital to analyse and highlight the extent to which states have achieved more fundamental ends of public health, such as equity [33].
Declaration of Competing Interest
The authors declare that they have no known competing financial interests or personal relationships that could have appeared to influence the work reported in this paper.
Appendix A. The vaccine campaign process: From factories to arms
The US Department of Health & Human Services breaks this process into three distinct stages: allocation, distribution, and administration [34]. Exhibit 6 provides an overview of these three stages.
Exhibit 6.
The vaccine delivery process.
Allocation of doses across states
On a weekly basis, authorised manufacturers indicate to the federal government how many vaccines they have available for distribution [34]. The government then allocates the majority of those doses across state- and territory health departments in proportion to the share of the national adult population residing in each area. In addition to this pro rata allocation, a share of the available doses are allocated directly to federally supported programmes. These include the Federal Retail Pharmacy Program, through which more than 40,000 retail pharmacies such CVS and Walgreens administered about a third of all doses given by late June 2021; the Rural Health Clinic COVID-19 Vaccine Distribution Program, which aimed to increase the vaccine availability in rural communities through about 4,600 rural health clinics; the Health Center COVID-19 Vaccine Program, in which less than 1,000 community-based health centres provide vaccinations for particularly vulnerable and poor families; the mass-vaccination sites managed by the Federal Emergency Management Agency beginning in March 2021; and the Indian Health Service, which supports tribal health programmes as well as the urban indigenous communities in the United States.
Distribution of vaccines to the states
Although the federal government manages the allocation of vaccines, the states themselves have played an active role in the distribution process [34]. Crucially, state health departments are responsible for placing orders for the doses that were allocated directly to them and are not able to place an order for doses unless there is a confirmed destination site to which the vaccines can be delivered, which poses a particular challenge given the cold chain requirements and expiration date of the vaccines. States that successfully launched more vaccination sites were able to place larger orders, meaning that despite the pro rata allocation, actual distribution rates have varied dramatically between states, particularly during the first months of the campaign. As of February 15 2021, Alaska had distributed more than twice as many vaccines per capita as Nevada.
Administration of vaccines to the population
Once distributed, vaccines are administered to eligible recipients by qualified healthcare professionals in a wide range of inpatient and outpatient settings (Exhibit 6), including hospitals, pharmacies, and long-term care facilities.
Appendix B. Data
Sources
The main data sources are the US Centers for Disease Control (US CDC), the Kaiser Family Foundation (KFF), the US Census Bureau, Americas Health Rankings (AHR), and Cook Political. All data are publicly available (Exhibit 7 ).
Exhibit 7.
Data sources for variables in the main model.
Healthcare expenditure is defined as:”all privately and publicly funded personal healthcare services and products (hospital care, physician services, nursing home care, prescription drugs, etc.) (…). Hospital spending is included and reflects the total net revenue (gross charges less contractual adjustments, bad debts, and charity care). Costs such as insurance program administration, research, and construction expenses are not included in this total.” [35].
Public health expenditure is defined by Americas Health Rankings as”State dollars dedicated to public health and federal dollars directed to states per person by the Centers for Disease Control and Prevention and the Health Resources Services Administration” [36].
Considered variables not included in the regression analysis
Exhibit 8 presents the variables that were considered in regression analyses but were excluded from the model that they did not meet any of these three conditions: (1) the variable was independently associated with vaccination rates, (2) it appeared to considerably confound the magnitude of the association between another variable and administration rates, or (3) it seemed a priori to be vitally important, such that even a null-result would be of interest.
Exhibit 8.
Excluded variables.
Appendix C. Methods
Model specification
Our multivariable linear regression can be specified as:
| (1) |
Where the outcome variable Yit represents the vaccinations per capita for a state i among N states at time t; X 1 through Xk are a set of time-invariant regressors; β 1 through βk are the regression coefficients for these variables, β 0 is the intercept; and ∊it is the error term. While the meaning of each β ^ simply is the linear change in Yit associated with a one-unit increase in Xk, the interpretation of each coefficient depends on the scale of the respective explanatory variable.
Diagnostic tests
This appendix provides further detail on the three diagnostic tests conducted for the primary cross-sectional regressions with vaccinations per capita on February 1, June 1, and September 21 regressions. In summary, we find that the validity of our results does not appear to be threatened by neither excessive collinearity of explanatory variables nor heteroscedasticity of errors, but that the skewed distribution of residuals recommend mitigating the influence of outliers using re-weighted least squares instead of ordinary least squares regression.
Post-estimation test for heteroskedasticity
A key assumption of ordinary least squares regression is that the error term has the same variance for any value of the explanatory variables [37], i.e. that the errors are homoscedastic. If this assumption is violated, coefficient standard errors – and hence confidence intervals and p-values – may be unreliable. To assess potential heteroscedasticity, we conducted the Breusch-Pagan post-estimation test for the three main regressions. Exhibit 9 reports χ 2 and p-values.
Exhibit 9.
Breusch-Pagan/Cook-Weisberg test for main regressions.
The fact that all p ≥ 0.167 suggests that the errors are not excessively heteroscedastic for any of the three regressions.
Quantile-quantile plots for residuals
The validity of confidence intervals and p-values based on ordinary least squares regression is sensitive to whether the residuals are normally distributed [37]. Consequently, the standard inferential techniques for ordinary least squares may be inappropriate for data with highly influential outliers. Exhibit 10 contains quantile–quantile plots for our three primary cross-sectional regressions, each of which (moderately) suggests that the residuals are not normally distributed. To mitigate the influence of outliers with large residuals, we employed iteratively re-weighted least squares regression (IRLS) using the rlm() package in R, which down-weights cases with large residuals [10].
Exhibit 10.
Quantile-quantile plots.
Post-estimation test for multicollinearity
Another important assumption of least squares regression is that there is no perfect collinearity between included explanatory variables, i.e. that no variable is an exact linear combination of the other explanatory variables [37]. To assess potential multicollinearity, we estimated the variance inflation factor (VIF) for all variables included in our primary cross-sectional regression using the vif command in Stata [38], see Exhibit 11 . Although the variance inflation factor is an incomplete way of assessing multicollinearity [39], the fact that VIF 3.14 for all explanatory variables provides some reassurance that the variables are not excessively collinear, as a VIF threshold of 10 is a commonly used heuristic for the collinearity of variables [38].
Exhibit 11.
Variance inflation factors test for explanatory variables.
Appendix D. Rolling regressions
Exhibit 12.
Rolling regression coefficients of variables, February 1 to September 21.
Appendix E. Sensitivity analyses
Robustness to an alternative outcome measure
Although the relative pace of vaccinations between states changed over time (see Exhibit 3), the cumulative number of vaccinations in a state at any point in time correlates with the cumulative number at any subsequent point. Thus, given the high degree of autocorrelation over time, the cross-sectional regressions in Exhibit 4, Exhibit 5 cannot be seen as multiple pieces of entirely independent evidence for the same associations. If certain states had done extraordinarily well in the first few months of the campaign, creating associations between vaccination rates and the characteristics of those states, these associations would partially persist even if the states performed poorly in subsequent months due to the cumulative (and hence autocorrelated) nature of the outcome measure. To see if the associations can be observed in the absence of such autocorrelation, we ran regressions with the increases in new vaccinations administered per capita during February, June, and September as the dependent variable (Exhibit 13 ).
Exhibit 13.
New monthly vaccinations per capita, February, June, and September.
With this outcome measure, some key results remain unchanged. As with the analysis of cumulative vaccinations, public health expenditure is associated with new vaccinations in February but not in subsequent periods. Similarly, there are initially no associations for vaccine hesitancy and Democratic voting but these arise in June. The results obtained with this measure depart from the main results reported in Exhibit 4 in a few ways. First, neither cost obstacles to care nor elderly population share are associated with vaccination rates in June, suggesting that the relationships that had emerged between those variables and cumulative June 1 vaccinations did not persist into the subsequent period. Second, and more notably, the observed associations for September 21 entirely disappear when month-on-month vaccinations are considered. While one interpretation is that the relevant independent variables really no longer were associated with vaccination outcomes in September, two other explanations merit consideration. First, the period is limited to the three weeks of September before as booster administration was authorised. Second, vaccination rates were considerably slower in September relative to previous months (see Exhibit 4). Both of these factors mean that relatively few vaccines were administered during the September 1–22 period, meaning that the analysis of new vaccinations could be underpowered to detect associations that would be observable with a longer analysis window and greater vaccination rates.
The role of vaccine distribution
From early on in the campaign, states have differed markedly in their ability to order and distribute the vaccines allocated to them. Moreover, distribution rates have consistently explained much of the variation in administration rates across states. Exhibit 14 shows the clear relationship (reported with Pearson’s ρ) between vaccine distribution and ad- ministration as of February 10 (the earliest date for which complete distribution data is available), even when excluding the outlier state of Alaska.
Exhibit 14.
Vaccine distribution and administration, February 10, 2021.
Our main model was constructed to examine associations between vaccination rates and time-invariant state characteristics measured before the vaccination campaign. This model did not include vaccine distribution rates, since distribution is causally downstream from more fundamental supply-side factors such as health expenditure. However, given that distribution represents a direct measure of the vaccine supply at any given point, it is instructive to examine whether some of the observed associations are driven by distribution rates. Indeed, vaccines distributed per capita on February 10 is correlated with both healthcare expenditure (Pearson’s ρ = 0.55) and public health expenditure (ρ = 0.65).
To shed light on this, we ran the model for cumulative vaccinations on February 10, June 1, and September 21 but this time including a time-varying measure of vaccines distributed per capita for each of these respective dates. Exhibit 15 shows the result of these cross-sectional regressions.
Exhibit 15.
Correlates of cumulative vaccinations per capita.
For both February and June, distribution rates are strongly associated with vaccination rates. Further, compared to the results from the model without distribution rates (Exhibit 4), a few things stand out. The positive associations for both expenditure measures disappear entirely across all three months. As noted in the Discussion, this evidence is consistent with the interpretation that states with stronger healthcare infrastructure, in the form of well-funded and well-staffed hospitals and clinics, were better able to launch vaccination sites through which doses could be ordered, distributed, and ultimately administered.
In contrast, the picture appears broadly unchanged for the main demand-side factors, vaccine hesitancy and cost obstacles: despite no association in February, there are clear negative associations both in June and, at least for vaccine hesitancy, in September. This is unsurprising considering that there is no clear reason why demand-side factors such as vaccine hesitancy would affect vaccine administration through distribution.
Robustness to omitted variable bias
General approach
As an observational study, any causal interpretation of these findings is threatened by omitted variable bias. Indeed, notwithstanding the inclusion of some important controls, our lack of a strong causal identification strategy makes it highly likely that the provided estimates are, to some extent, biased by selection on unobserved factors. The relevant question, then, is whether the magnitude of potential bias is likely to be large enough to threaten our overall conclusions. Oster [11] discusses how to evaluate whether selection on unobservables poses a severe threat to validity. She notes that looking at the difference between the coefficients of uncontrolled (bivariate) and controlled (multivariable) regressions is not sufficient to evaluate robustness to omitted variable bias without further assumptions about the relationship between selection on observables and selection on unobservables. For example, even if the estimated β-coefficients move very little between an uncontrolled and a controlled regression, omitted variable bias could still invalidate the results if unobserved factors accounted for enough of the variation in the outcome. To address this, Oster extends prior work by Altonji et al. [40] to provide a method that considers not only coefficient movements but also changes in R 2. She presents a measure, δ, of the relative amount of selection on unobservables compared to selection on observables it would take to nullify the observed association. Oster proposes a threshold of 1 for δ to determine whether results should be considered robust. In other words, she argues that results are robust if δ is greater than 1, i.e., if selection on unobservables would have to be greater than the selection on included observables to yield a β-coefficient of zero. We consider the associations from Exhibit 4 for which we obtained p-values below 0.05 and use the psacalc Stata module to estimate δ; see [11] for the mathematical formula. The arbitrary α-threshold of 0.05 was chosen based on what the psacalc module uses.
Exhibit 16, Exhibit 17, Exhibit 18 present this analysis for the February, June, and September regressions. Because the analysis of δ relies on the psacalc module, it is based on regressions conducted with the reg command and the,robust option in Stata. Consequently, coefficients and p-values differ very slightly from those obtained with the rlm() command in R reported elsewhere.
Exhibit 16.
Robustness of September 21 associations to unobservable selection.
Exhibit 17.
Robustness of June 1 associations to unobservable selection.
Exhibit 18.
Robustness of February 1 associations to unobservable selection.
For the June and September regressions, all but one δ are above 1. This implies that even if selection on unobservables was as great as selection on the included explanatory variables, the main associations would remain significantly different from zero (again using the arbitrary α = 0.05).
For the February regression, the δ less than 1 suggests that even if selection on unobservables was less in magnitude than selection on observables, the results could be nullified by including all unobserved factors. In other words, the associations do not appear as robust to omitted variable bias as the June and September associations.
Empirical exploration of omitted variable bias
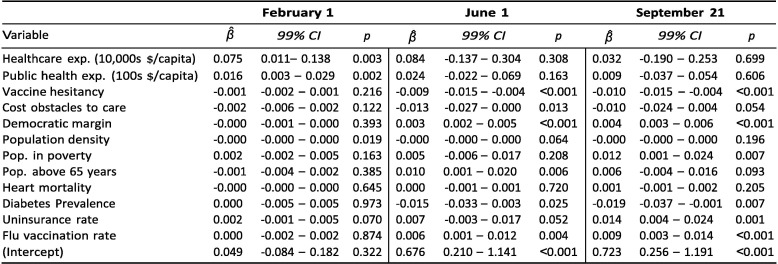
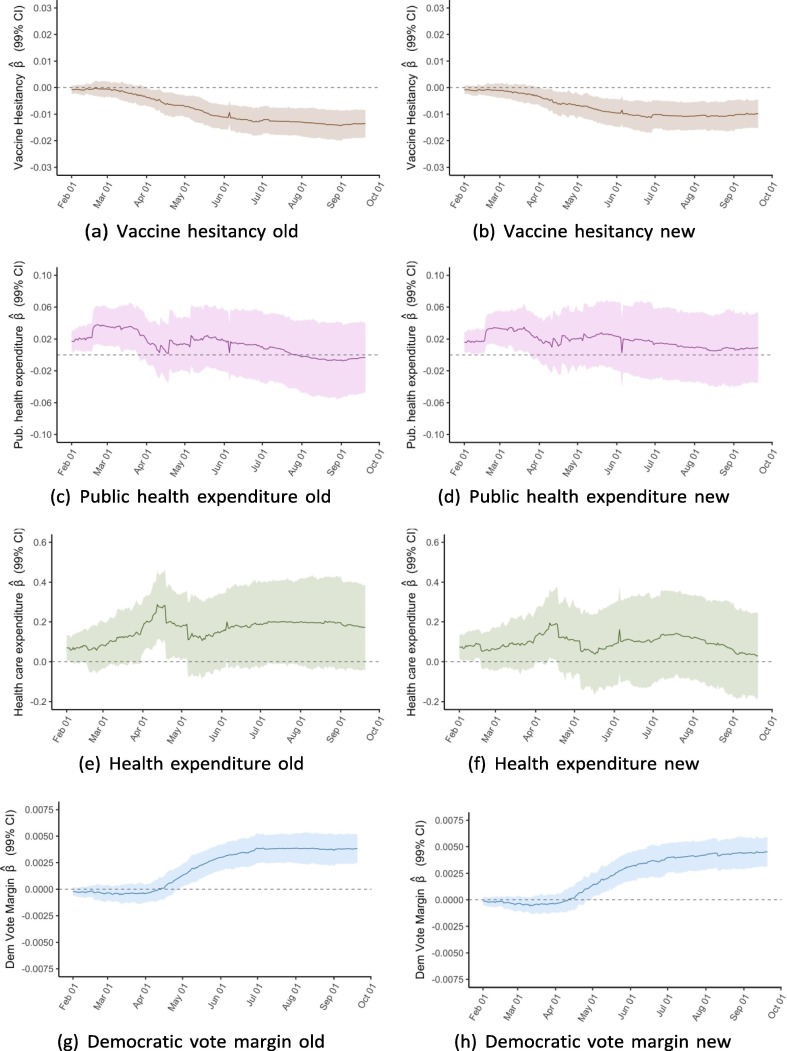
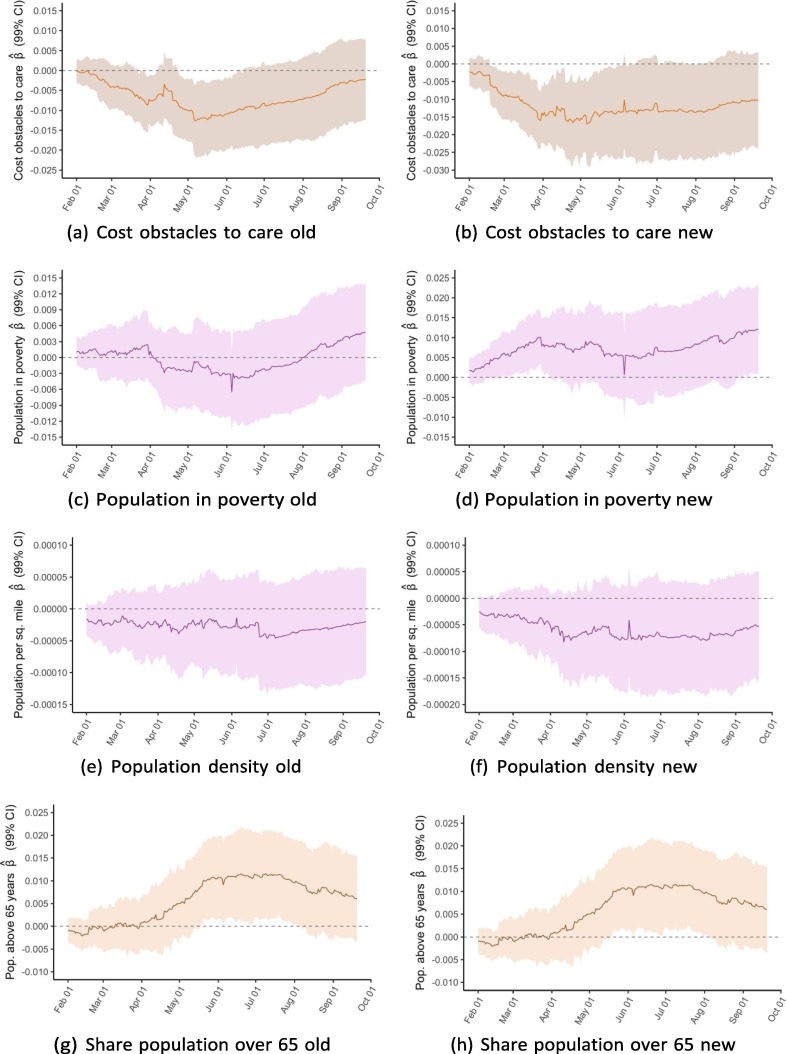
While the analysis based on Oster suggests that most of our main findings are robust to even a substantial degree of potential selection on unobservables, the omission of particular variables may raise concerns about confounding. As an additional robustness check for omitted variable bias, we reproduce our primary regression analysis results including a series of additional variables that control for four particularly salient potential confounding factors. The additional variables included are summarized in Exhibit 19 . Exhibit 20 reports the results from including the additional controls in the regression model that was estimated to produce the results in Exhibit 4, while Exhibit 21 displays side-by-side the evolution of the variable coefficients over time in the original (left panels) and new (right panels) regression model.
Exhibit 19.
Data sources for additional variables used in robustness regressions.
Exhibit 20.
Correlates of cumulative vaccinations per capita with new controls.
Exhibit 21.
Comparison of rolling regression with/out new controls.
The new results provided in Exhibit 20, Exhibit 21 suggest that our main results are not substantially changed by the inclusion of these variables. In the new regressions, healthcare expenditure and public health expenditure are associated with vaccination in February (p = 0.003 and p = 0.002, respectively) but not in June (p = 0.308; p = 0.163) or September (p = 0.699; p = 0.606). As such, the inclusion of the new variables accord with our original interpretation that “supply-side” factors became less significantly associated with vaccination rates over time.
Similarly, cost obstacles to care are not associated with vaccination rates in February (p = 0.122) but is in June (p = 0.013) and, to a lesser extent, in September (p = 0.054). These results are consistent with the trends observed in our original regressions, although the inclusion of the new variables does produce a clearer association between cost obstacles to care and vaccination rates in June and September. This finding also supports our suggestion that demand-side factors became more influential over time.
We note that poverty is not associated with vaccination rates in February (p = 0.163) and June (p = 0.208), but is in September (p = 0.07). The September finding somewhat differs from our original results, although the direction of the correlation remains the same. Furthermore, although the trend line exhibited by the regression coefficient over time does appear qualitatively different from the original trend line, they are within the error margins of one another.
The estimated coefficients and confidence intervals for Democratic voting, vaccine hesitancy, share of population over 65, and population density do not seem to meaningfully change as a result of the inclusion of the new variables.
Robustness to dropping individual states
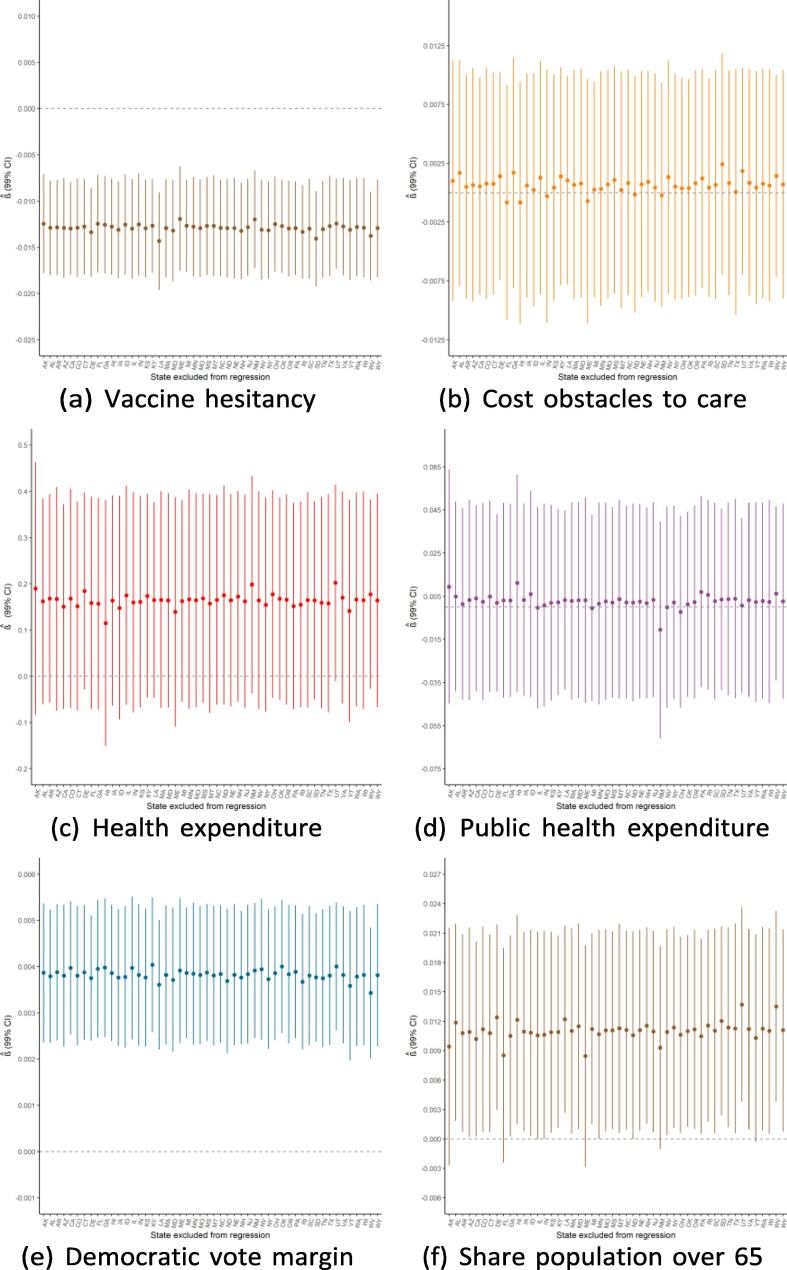
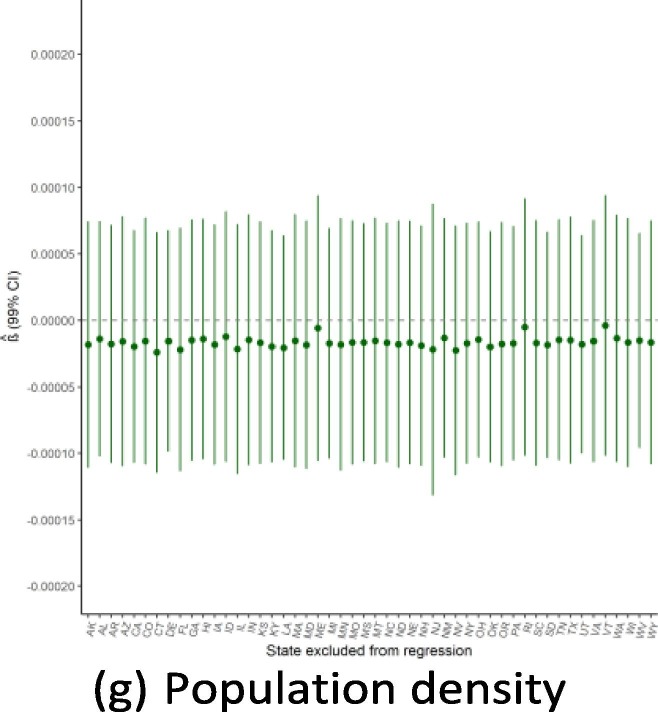
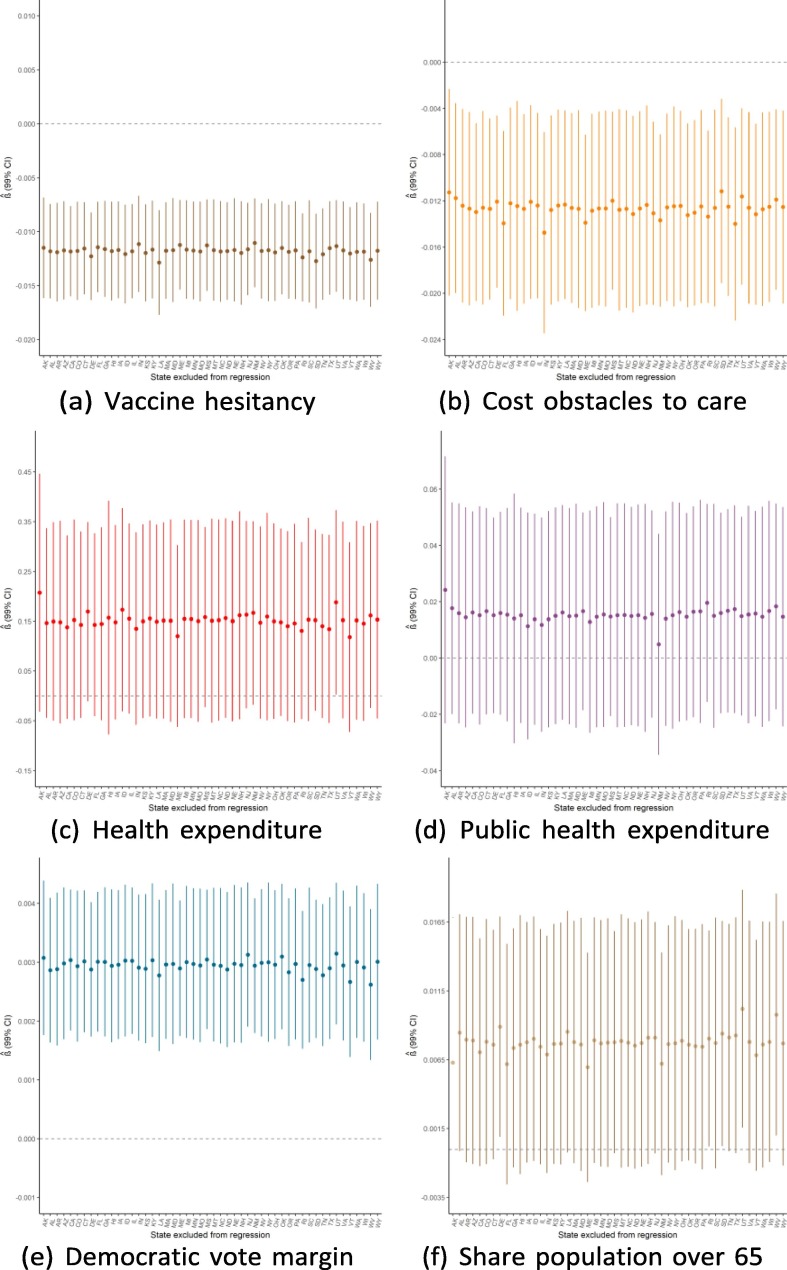
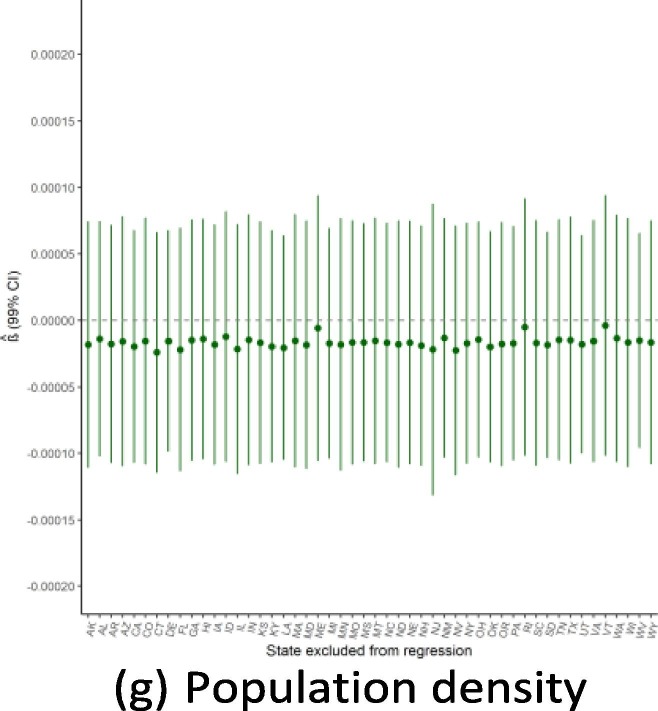
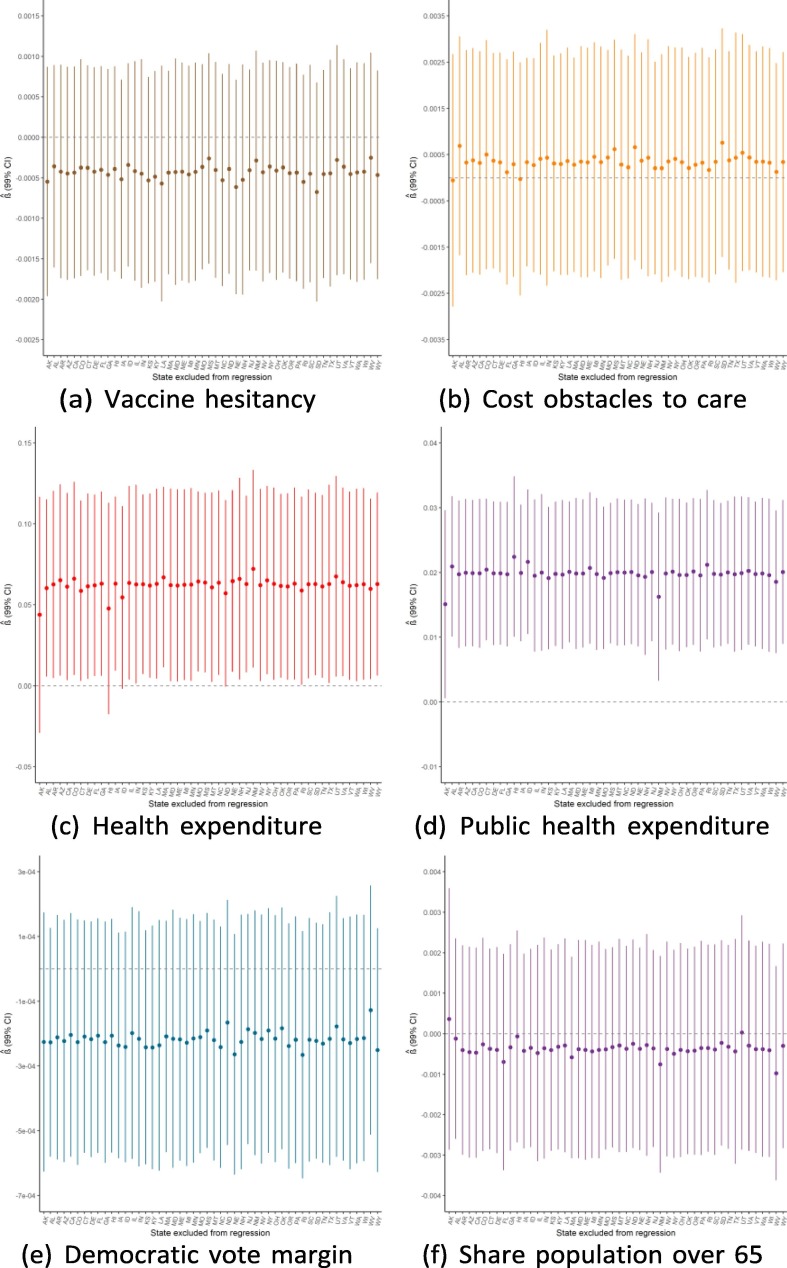
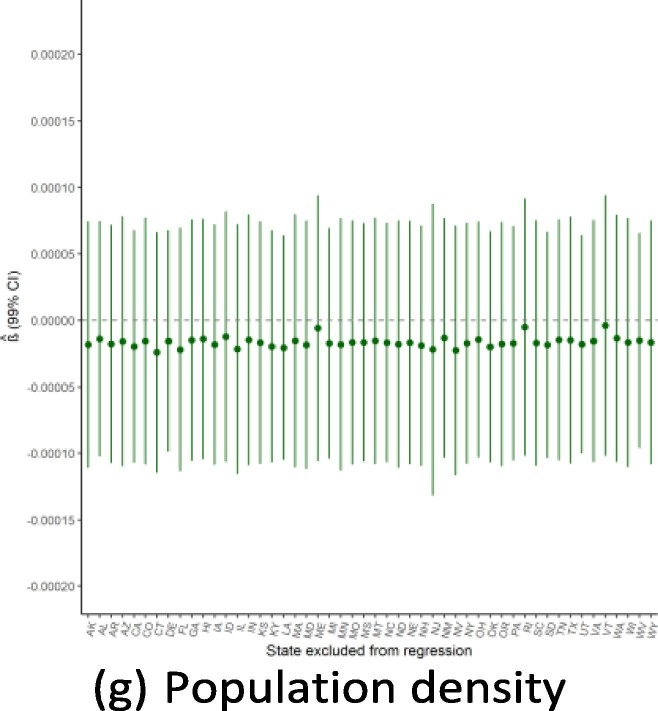
Given the small sample size available for state-level regressions (N = 50), a potential threat to the validity of this study would be if the findings were driven by the influence of a single outlying state. Because of this concern, we ran the main regressions while dropping one state a time to see how the results from Exhibit 4 are affected by this step-wise exclusion. Exhibit 19, Exhibit 20, Exhibit 21 show the results for the September, June, and February regressions, respectively. In general, these figures reveal that the observed associations (or absences of any association) are not affected by dropping individual states from anal- ysis, though with a few notable exceptions: the February relationship with public health expenditure is highly influenced by the exclusion of Alaska and New Mexico; the September relationship with the elderly share of the population is considerably influenced by dropping states such as Alaska, Florida, and Maine; and the lack of association with population density is strongly influenced by excluding New Jersey. Notwithstanding these influential data points, this robustness analysis shows that the main results generally are not driven by the outcomes in any individual state (Exhibit 22, Exhibit 23, Exhibit 24 ).
Exhibit 22.
Regression robustness to excluding individual states, September 21.
Exhibit 23.
Regression robustness to excluding individual states, June 1.
Exhibit 24.
Regression robustness to excluding individual states, April 1.
Data availability
All data and code for this project are publicly available at https://osf.io/8vgks/. For any inquiries, please contact the corresponding author.
References
- 1.A. David Paltiel, Jason L. Schwartz, Amy Zheng, and Rochelle P. Walensky. Clinical Outcomes Of A COVID-19 Vaccine: Implementation Over Efficacy. Health Aff., Nov 2020. [DOI] [PMC free article] [PubMed]
- 2.Michaeleen Doucleff. How Rich Countries Are ’Hoarding’ The World’s Vaccines, In Charts. NPR, Dec 2020.
- 3.K Viswanath, Mesfin Bekalu, Dhriti Dhawan, Ramya Pinnamaneni, Jenna Lang, and Rachel McLoud. Individual and social determinants of covid-19 vaccine uptake. BMC Public Health, 21(1):1–10, 2021. [DOI] [PMC free article] [PubMed]
- 4.Madhura S Rane, Shivani Kochhar, Emily Poehlin, William You, McKaylee Robert- son, Rebecca Zimba, Drew Westmoreland, Matthew Romo, Sarah Kulkarni, Mindy Chang, et al. Determinants of covid-19 vaccine hesitancy and vaccine uptake in a national cohort of us adults. medRxiv, 2021. [DOI] [PMC free article] [PubMed]
- 5.Brown C.C., Young S.G., Pro G.C. Covid-19 vaccination rates vary by community vulnerability: A county-level analysis. Vaccine. 2021 doi: 10.1016/j.vaccine.2021.06.038. [DOI] [PMC free article] [PubMed] [Google Scholar]
- 6.Nicholas Stewart, Peter Smittenaar, Staci Sutermaster, Lindsay Coome, and Sema K Sgaier. Inequities among vulnerable communities during the covid-19 vaccine rollout. medRxiv, 2021.
- 7.Emily Lindemer, Mayank Choudhary, Gregory Donadio, Colin Pawlowski, and Venky Soundararajan. Counties with lower insurance coverage are associated with both slower vaccine rollout and higher covid-19 incidence across the united states. medRxiv, 2021. [DOI] [PMC free article] [PubMed]
- 8.H́ector M Coĺon and Marizaida Śanchez-Cesareo. Disparities in health care in Puerto Rico compared with the United States. JAMA internal medicine, 176(6):794–795, 2016. [DOI] [PubMed]
- 9.Stephanie Brien, Jeffrey C Kwong, Katia M Charland, Aman D Verma, John S Brownstein, and David L Buckeridge. Neighborhood determinants of 2009 pandemic A/H1N1 influenza vaccination in Montreal, Quebec, Canada. American Journal of Epidemiology, 176(10):897–908, 2012. [DOI] [PMC free article] [PubMed]
- 10.UCLA: Statistical Consulting Group. R Data Analysis Examples, 2021. [Online; accessed 23. Aug. 2021].
- 11.Emily Oster. Unobservable selection and coefficient stability: Theory and evidence. Journal of Business & Economic Statistics, 37(2):187–204, 2019.
- 12.Schwartz S. The fallacy of the ecological fallacy: the potential misuse of a concept and the consequences. Am J Public Health. 1994;84(5):819–824. doi: 10.2105/ajph.84.5.819. [DOI] [PMC free article] [PubMed] [Google Scholar]
- 13.Hemi Tewarson, Katie Greene, and Michael R Fraser. State strategies for addressing barriers during the early us covid-19 vaccination campaign, 2021. [DOI] [PMC free article] [PubMed]
- 14.Walkey A.J., Law A., Bosch N.A. Lottery-based incentive in ohio and covid-19 vaccination rates. JAMA. 2021 doi: 10.1001/jama.2021.11048. [DOI] [PMC free article] [PubMed] [Google Scholar]
- 15.Margaret Brehm, Paul Brehm, and Martin Hugo Saavedra. The Ohio vaccine lottery and starting vaccination rates. SSRN, Jun 2021. [Online; accessed 28. Jun. 2021].
- 16.Eleni Mantzari, Florian Vogt, and Theresa M Marteau. Financial incentives for increasing uptake of hpv vaccinations: a randomized controlled trial. Health Psy- chology, 34(2):160, 2015. [DOI] [PMC free article] [PubMed]
- 17.Randi Beth Singer, Natasha Crooks, Rebecca Singer, Noel Green, Jahari Stamps, Crystal Patil, and Alicia Matthews. Ballroom icons and the power to promote covid-19 vaccination among black and brown lgbtq+ individuals. American journal of public health, 112(1):17–20, 2022. [DOI] [PMC free article] [PubMed]
- 18.Davila-Payan C., Swann J., Wortley P.M. System factors to ex- plain h1n1 state vaccination rates for adults in us emergency response to pandemic. Vaccine. 2014;32(25):3088–3093. doi: 10.1016/j.vaccine.2013.05.069. [DOI] [PubMed] [Google Scholar]
- 19.Davila-Payan C., Swann J., Wortley P.M. System factors to explain 2009 pandemic h1n1 state vaccination rates for children and high-risk adults in us emergency response to pandemic. Vaccine. 2014;32(2):246–251. doi: 10.1016/j.vaccine.2013.11.018. [DOI] [PMC free article] [PubMed] [Google Scholar]
- 20.Brien S., Kwong J.C., Buckeridge D.L. The determinants of 2009 pandemic a/h1n1 influenza vaccination: a systematic review. Vaccine. 2012;30(7):1255–1264. doi: 10.1016/j.vaccine.2011.12.089. [DOI] [PubMed] [Google Scholar]
- 21.The Lancet Nigeria Commission. Lancet commission on the economic burden of disease in Nigeria (Preliminary draft). Unpublished working paper, 2021.
- 22.Heidi J Larson, Caitlin Jarrett, Elisabeth Eckersberger, David MD Smith, and Pauline Paterson. Understanding vaccine hesitancy around vaccines and vaccination from a global perspective: a systematic review of published literature, 2007–2012. Vaccine, 32(19):2150–2159, 2014. [DOI] [PubMed]
- 23.Kaiser Family Foundation. KFF COVID-19 Vaccine Monitor – April 2021, May 2021. [Online; accessed 16. Jul. 2021].
- 24.Sarah Kliff. Why Coronavirus Tests Come With Surprise Bills. N.Y. Times, Sep 2020.
- 25.Dylan Scott. The Covid-19 vaccine is free, even if you get a health insurance bill. Vox, Apr 2021.
- 26.Lopez L., Hart L.H., Katz M.H. Racial and ethnic health disparities related to covid-19. JAMA. 2021;325(8):719–720. doi: 10.1001/jama.2020.26443. [DOI] [PubMed] [Google Scholar]
- 27.Kaiser Family Foundation. Workers Are More Likely to Get a COVID-19 Vaccine When Their Employers Encourage It and Provide Paid Sick Leave, Though Most Workers Don’t Want Their Employers to Require It, Jun 2021. [Online; accessed 6. Jul. 2021].
- 28.T Mark Doherty, Mark P Connolly, Giuseppe Del Giudice, Johan Flamaing, Jorg J Goronzy, Beatrix Grubeck-Loebenstein, Paul-Henri Lambert, Stefania Maggi, Janet E McElhaney, Hideaki Nagai, et al. Vaccination programs for older adults in an era of demographic change. European geriatric medicine, 9(3):289–300, 2018. [DOI] [PMC free article] [PubMed]
- 29.Toḿaˇs Gavenˇciak, Joshua Teperowski Monrad, Gavin Leech, Mrinank Sharma, S¨oren Mindermann, Jan Marcus Brauner, Samir Bhatt, and Jan Kulveit. Seasonal variation in SARS-CoV-2 transmission in temperate climates. PLoS Computational Biology, 2021. [DOI] [PMC free article] [PubMed]
- 30.Swapnil Mishra, S¨oren Mindermann, Mrinank Sharma, Charles Whittaker, Thomas A Mellan, Thomas Wilton, Dimitra Klapsa, Ryan Mate, Martin Fritzsche, Maria Zambon, et al. Changing composition of SARS-CoV-2 lineages and rise of Delta variant in England. EClinicalMedicine, 39:101064, 2021. [DOI] [PMC free article] [PubMed]
- 31.Marla Broadfoot. COVID Vaccine rollout pits fairness against speed. Sci. Am., Jun 2021. [Online; accessed 28. Jun. 2021].
- 32.Maxwell J. Smith. What constitutes success in the roll-out of COVID-19 vaccines? Lancet, 0(0), Jun 2021. [DOI] [PMC free article] [PubMed]
- 33.Sue C Lin. Equitable access and distribution of covid-19 vaccines for us vulnerable populations: Federal health center program perspective, 2021. [DOI] [PMC free article] [PubMed]
- 34.HHS. COVID-19 Vaccine Distribution: The Process, Jun 2021. [Online; accessed 23. Jul. 2021].
- 35.Kaiser Family Foundation. State Health Facts, Jun 2021. [Online; accessed 20. Aug. 2021].
- 36.AmericasHealthRankings.org. America’s Health Rankings analysis of CDC, HRSA and Trust for America’s Health, United Health Foundation, Aug 2021. [Online; accessed 20. Aug. 2021].
- 37.Wooldridge J.M. Introductory econometrics: A modern approach. Cengage learning. 2015 [Google Scholar]
- 38.Xiao Chen, Philip B. Ender, Michael Mitchell, and Christine Wells. Regression with Stata, 2003. [Online; accessed 23. Aug. 2021].
- 39.Robert M O’brien. A caution regarding rules of thumb for variance inflation factors. Quality & quantity, 41(5):673–690, 2007.
- 40.Altonji J.G., Elder T.E., Taber C.R. An evaluation of instrumental variable strategies for estimating the effects of catholic schooling. Journal of Human resources. 2005;40(4):791–821. [Google Scholar]
Associated Data
This section collects any data citations, data availability statements, or supplementary materials included in this article.
Data Availability Statement
All data and code for this project are publicly available at https://osf.io/8vgks/. For any inquiries, please contact the corresponding author.


