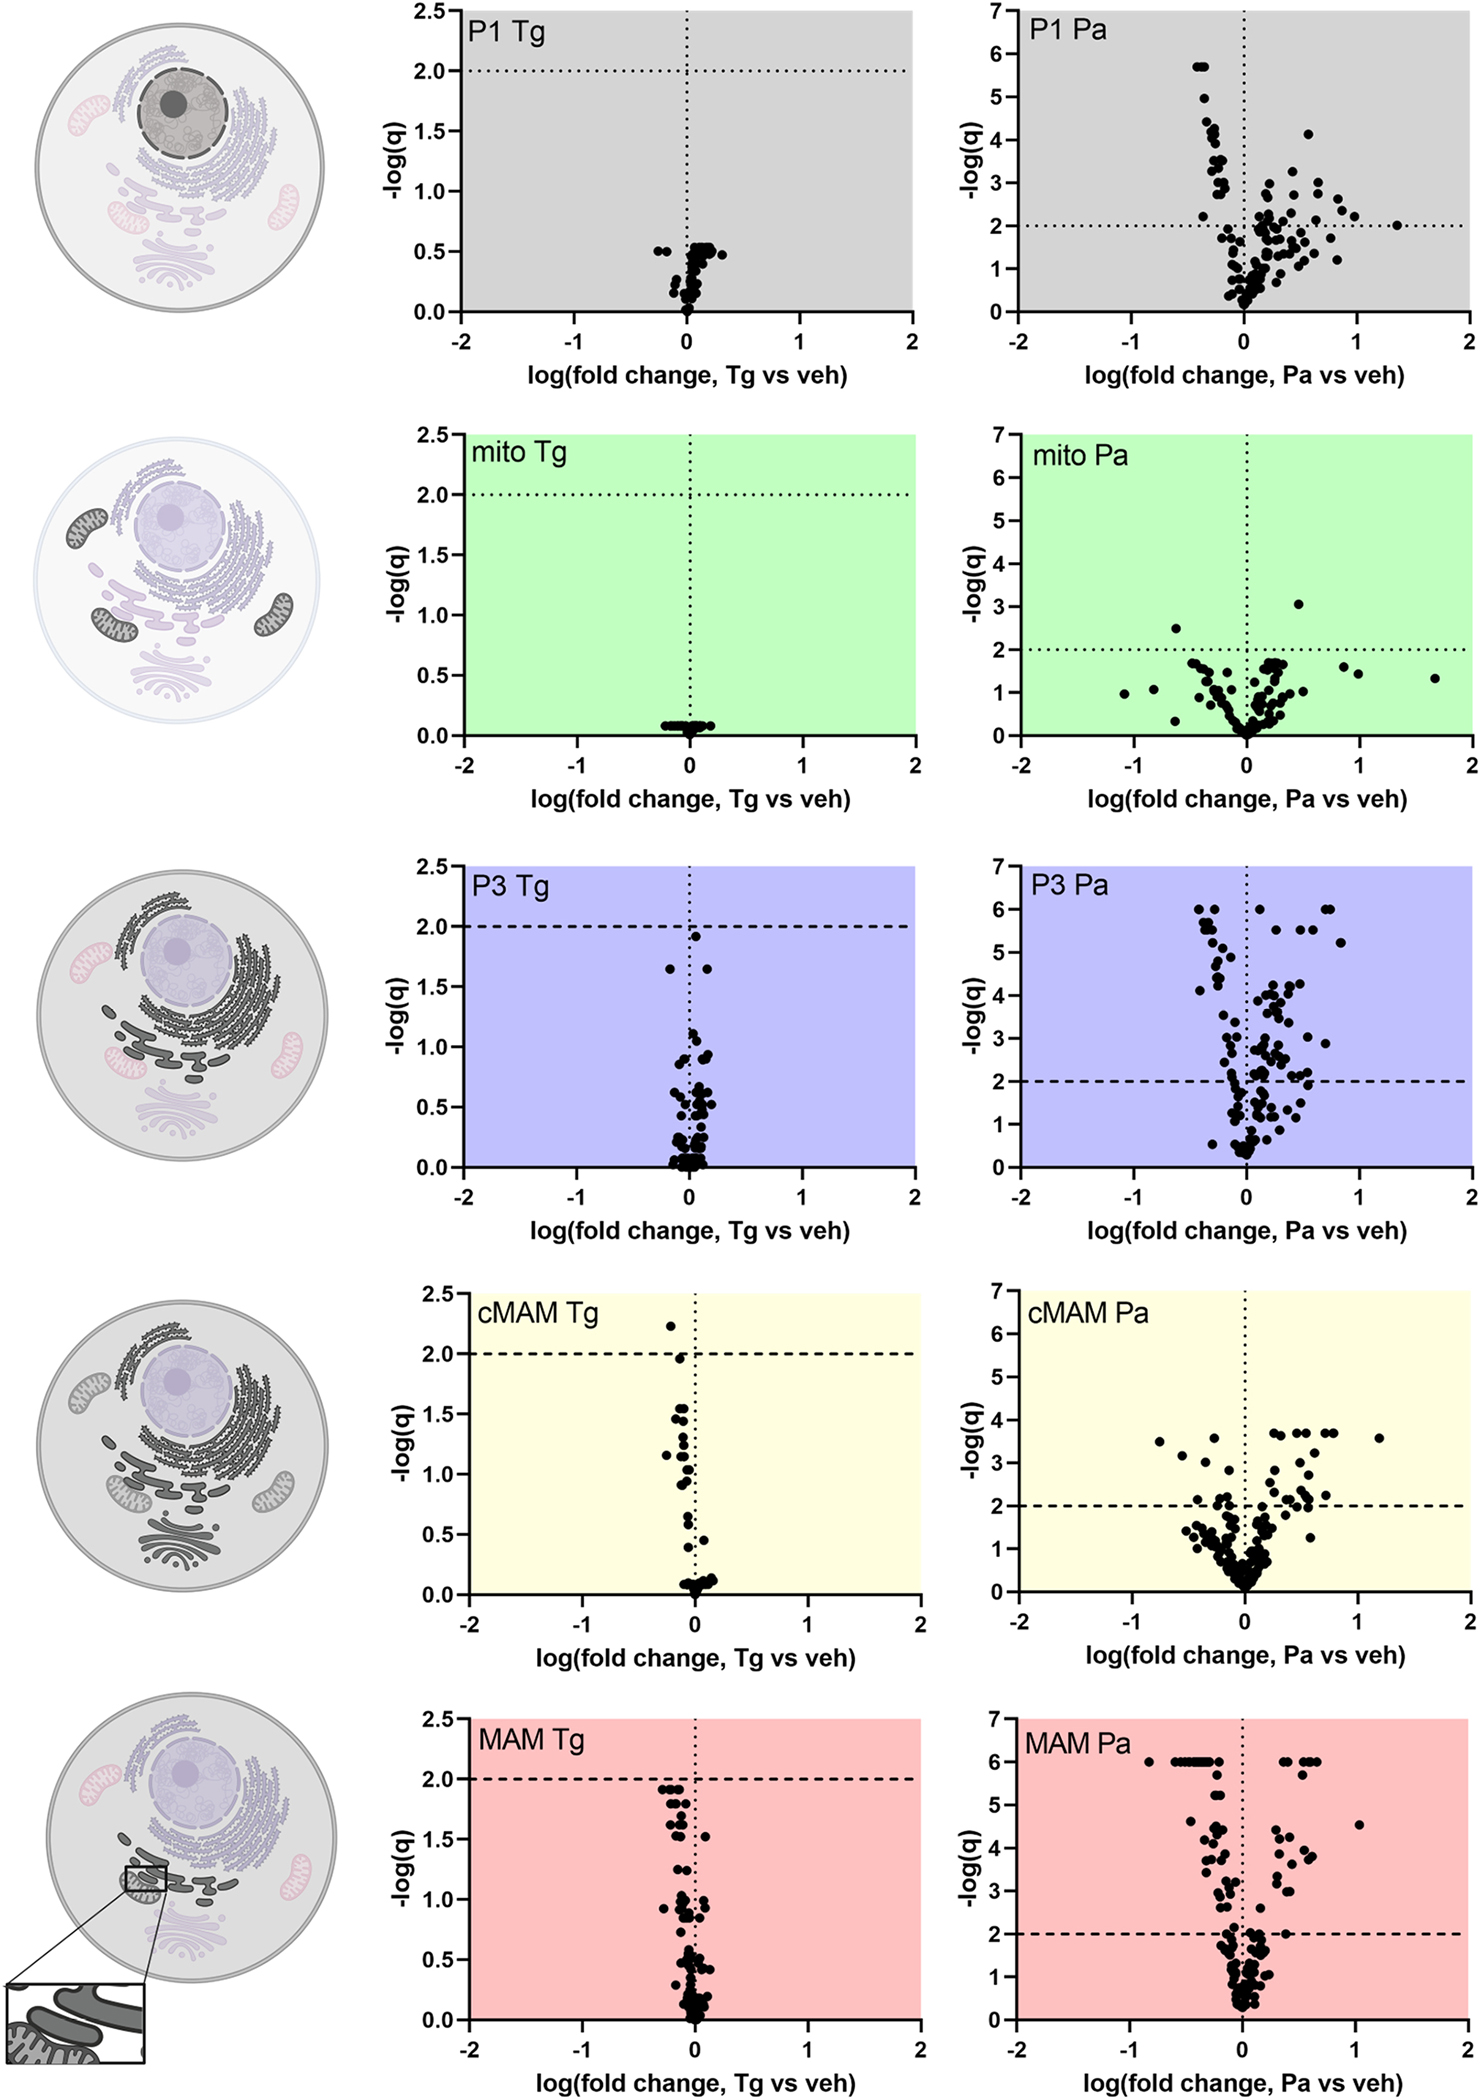
Figure 5. In SH-SY5Y cells palmitate causes robust changes in the phospholipids of different fractions, whereas thapsigargin does not.

Volcano plots showing the changes in lipid species in different fractions and graphical keys (left) to the cellular membranes that the fractions represent. The darker the membrane indicates it contributes to the corresponding fraction based on protein markers. The different fractions represent following membranes: P1, nuclei, some cell debris; mito, mitochondria; P3, microsome (ER); cMAM, ER, Golgi, some mitochondria; MAM, mitochondria associated membrane. There is also some plasma membrane present in P1, P3, cMAM and MAM fractions. Every dot in the volcano plot represents one phospholipid species detected by mass spectrometry. The phospholipids are blotted according to the logarithm of the fold change compared to vehicle (X-axis) and their q-value obtained from multiple t-tests (false discovery rate approach, Two-stage step-up method of Benjamini, Krieger and Yekutieli, FDR(q) set to 1%). Lipid species above the horizontal line (negative logarithmic q-value 2) are statistically significantly different from vehicle. CL, cardiolipins; cMAM, crude MAM fraction; MAM, mitochondria associated membrane; PA, phosphatidic acid; Pa, palmitate; PC, phosphatidylcholine; PE, phosphatidylethanolamine; PG, phosphatidylglycerol; PI, phosphatidylinositol; PS, phosphatidylserine; SM, sphingomyelin; Tg, thapsigargin; veh, vehicle. Cell images were created with BioRender.
