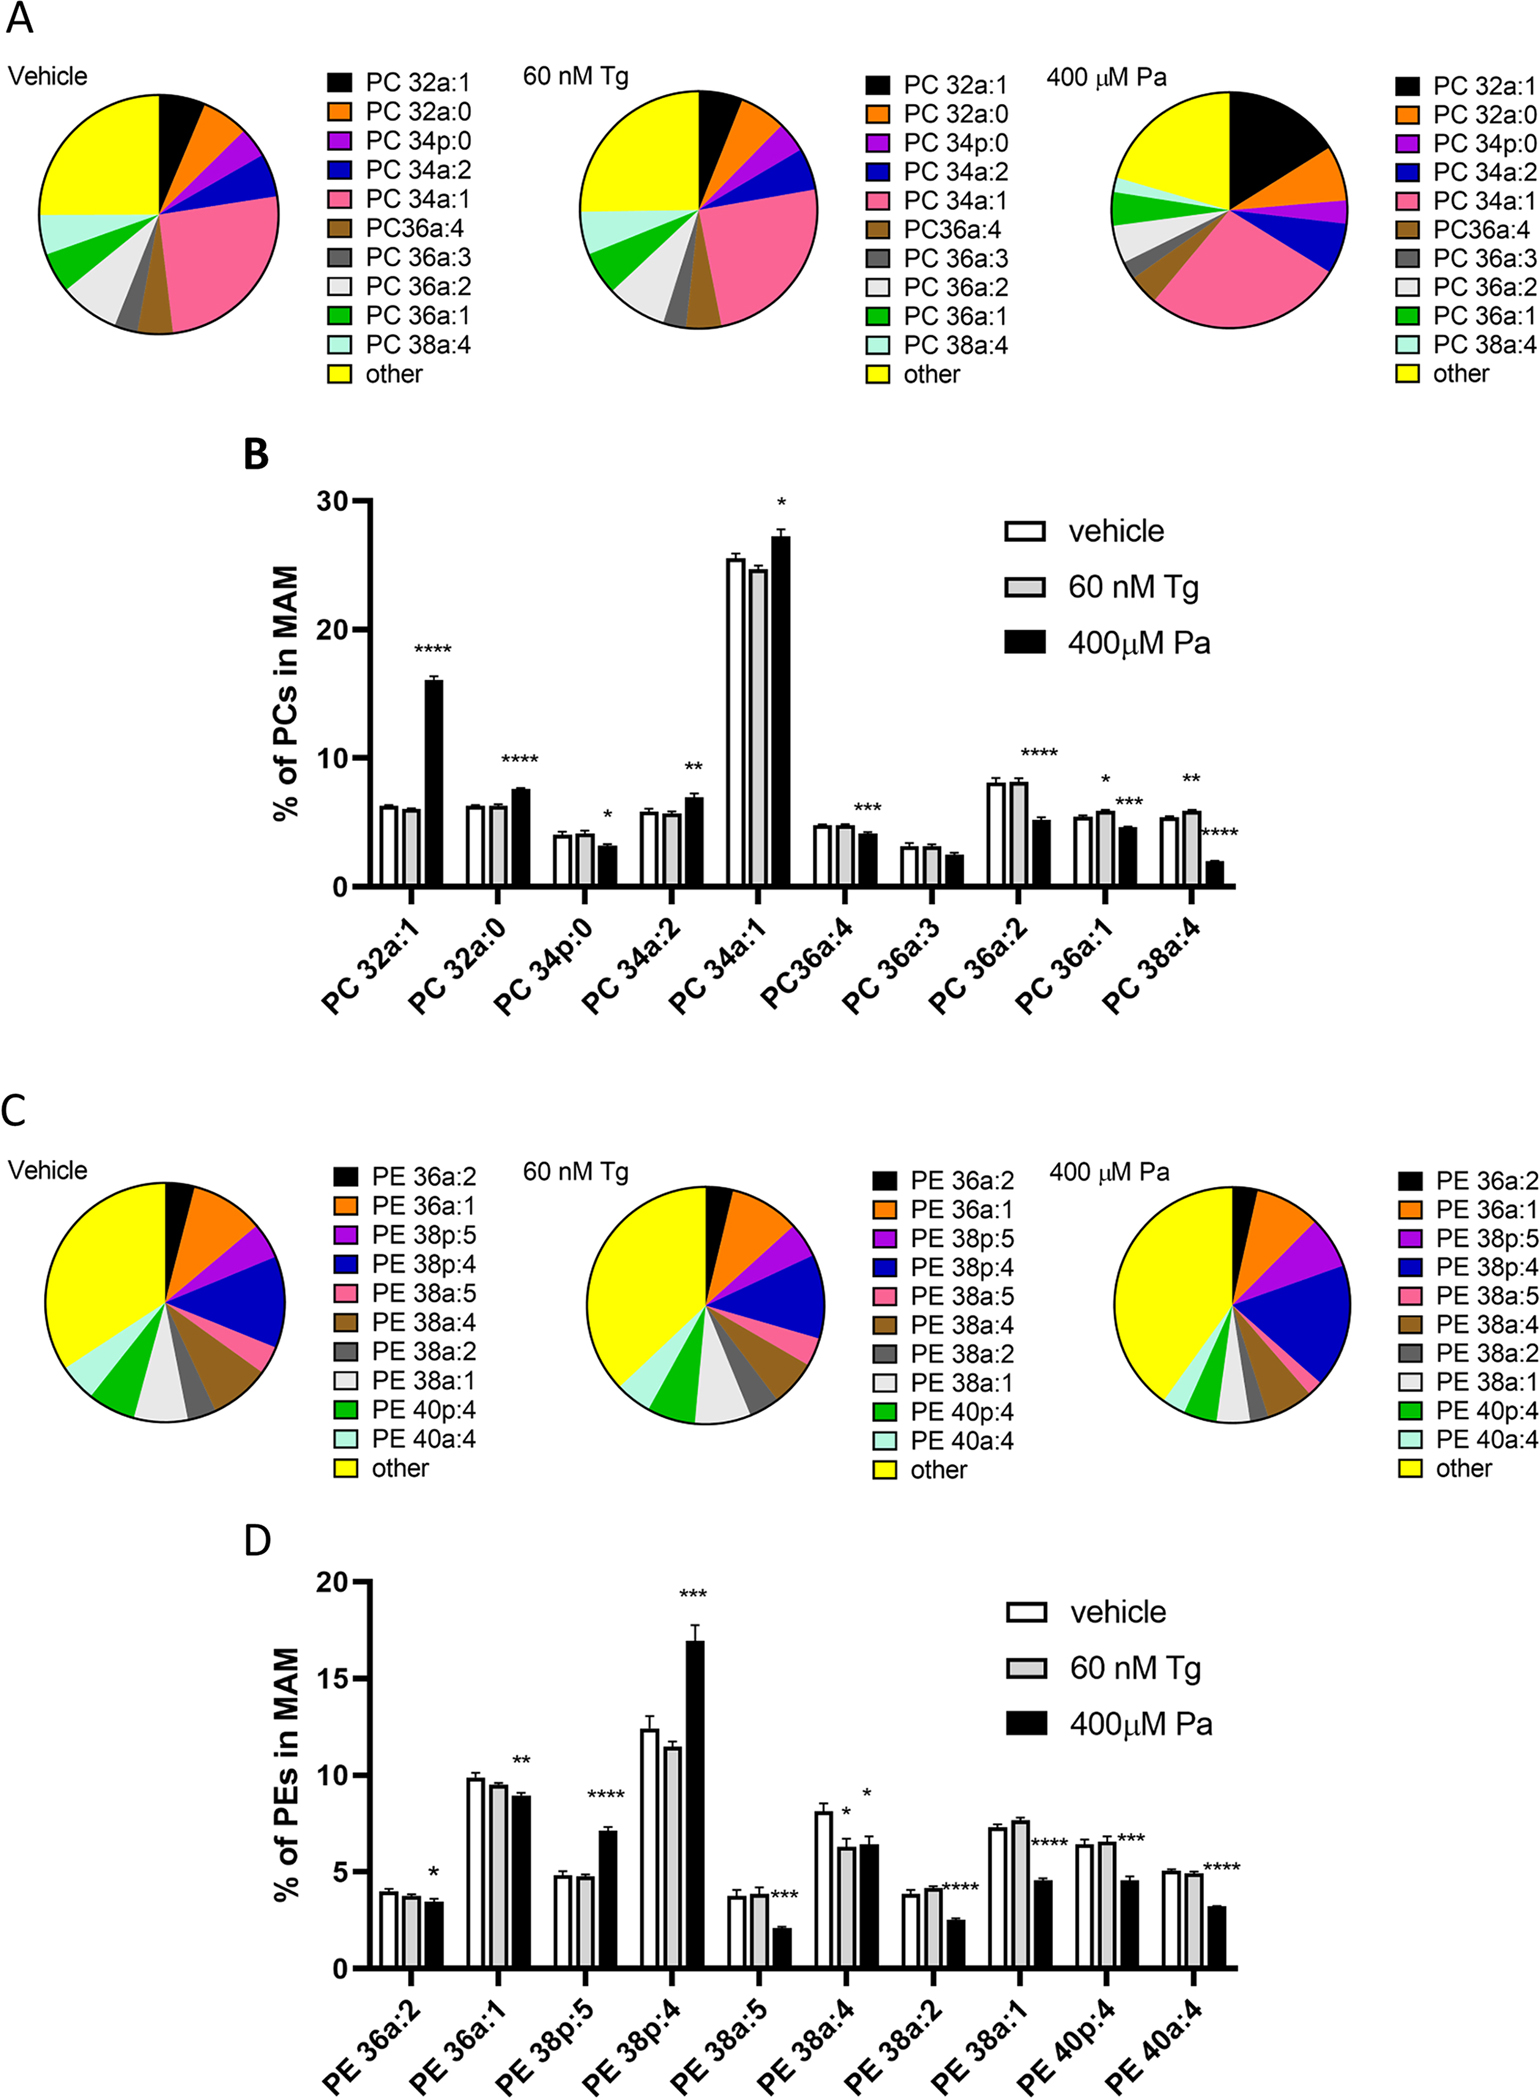
Figure 7. Palmitate changes the relative abundance of several most prevalent PC and PE species in the MAM fraction, whereas thapsigargin only changes three.

Changes in the 10 most abundant Phosphatidylcholine (PC) (A, B) and Phosphatidylethanolamine (PE) (C, D) species, measured with mass spectrometry, in the MAM fraction after 24-hour exposure to either thapsigargin or palmitate. All the lipid species were first normalized to internal standard of each sample and then the normalized signals were summed together (within a treatment) for PC and PE species separately, the percentages were calculated for each lipid species using the sum of all the species as 100%. One-way ANOVAS with Bonferroni multiple comparisons were run within every lipid species (n=6), significances are as follows * p<0.05, ** p<0.01, ***p<0.005, ****p<0.001.
