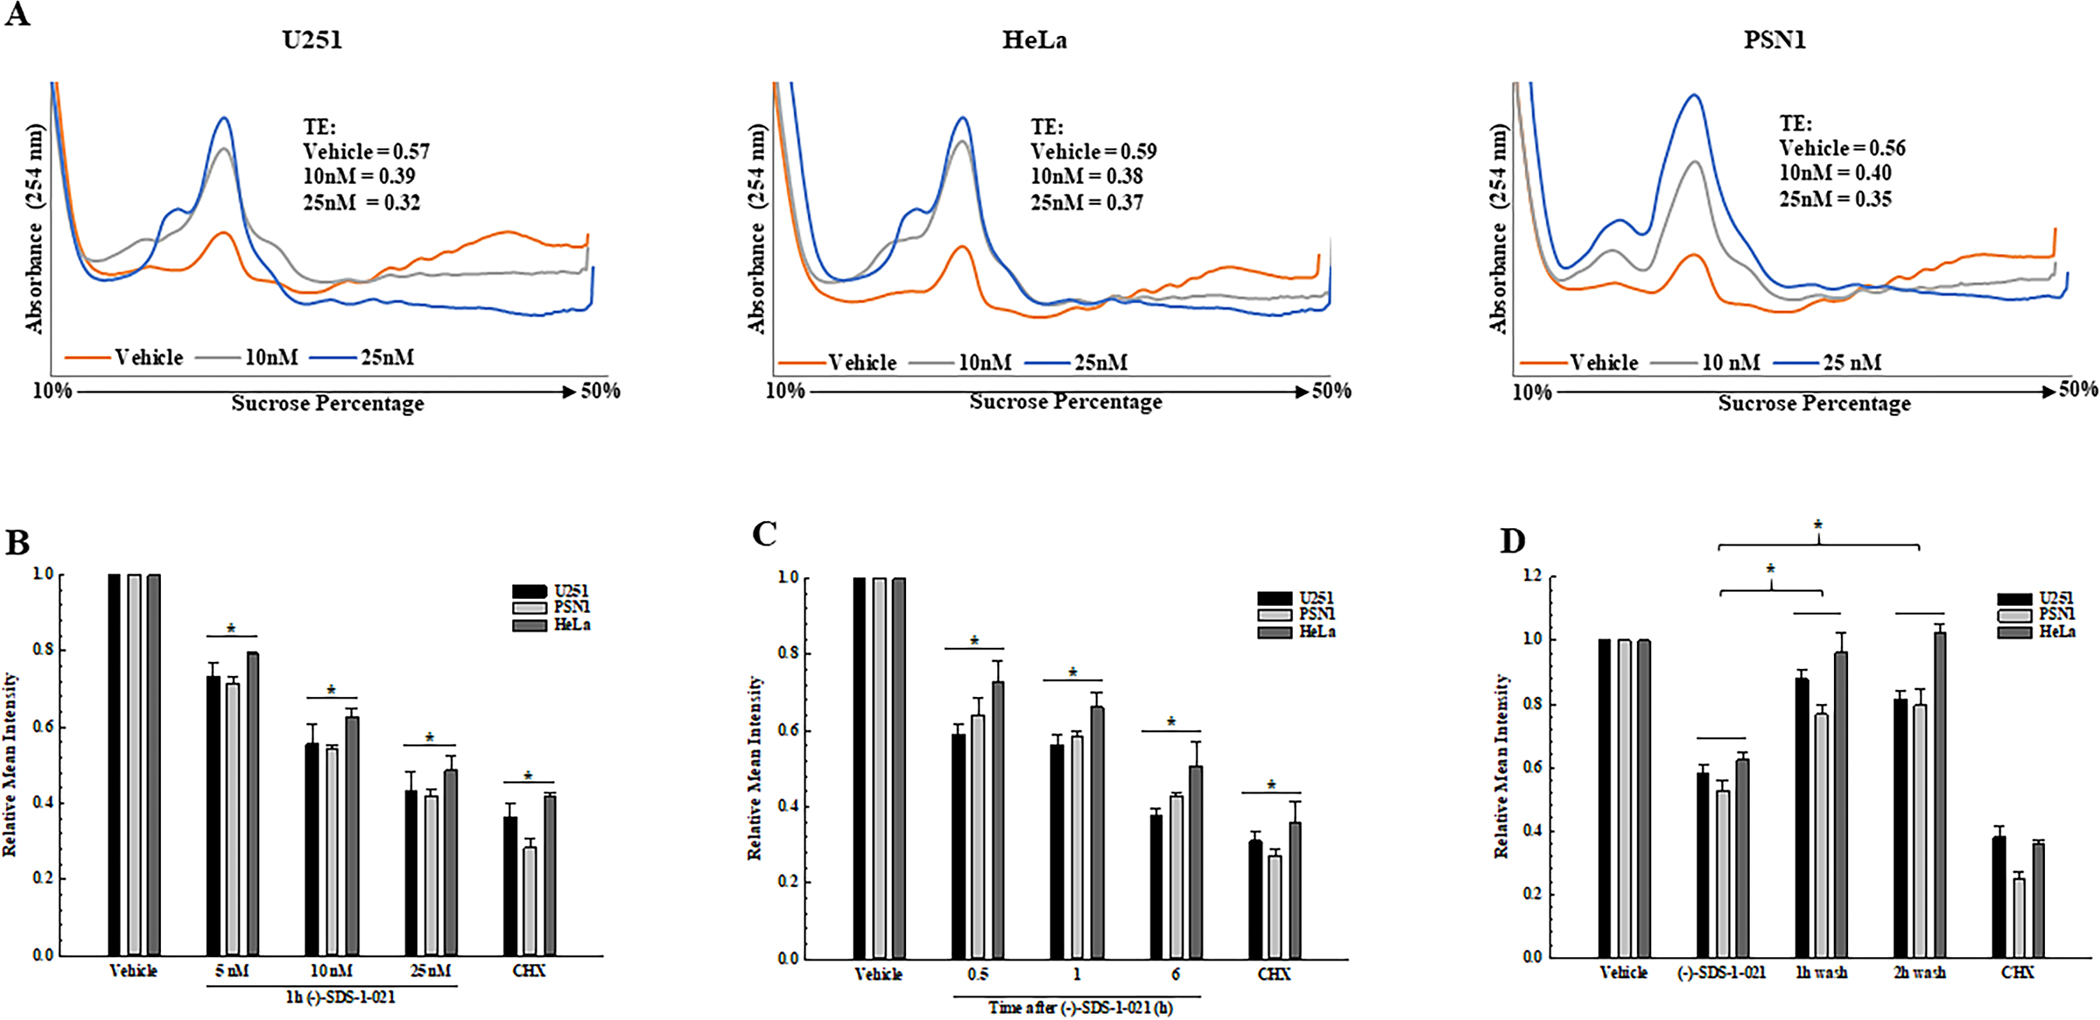
Figure 2.

Translational efficiency and protein synthesis in tumor cells treated with (−)-SDS-1-021. A. Polysome profiles were generated from U251, HeLa, and PSN1 cell lines at 1 h after exposure to 10 or 25 nM (−)-SDS-1-021. TEs calculated from the polysome profiles are shown (single experiment). B. Protein synthesis measured as a function of (−)-SDS-1-021 dose (1 h). C. Protein synthesis (OPP incorporation) measured as a function of (−)-SDS-1-021 (10 nM) treatment time. D. Protein synthesis measured by OPP incorporation following (−)-SDS-1-021 wash out after treatment for 1 h with 10 nM. In B-D, values represent the mean of three independent experiments ± SEM. * p<0.05 by one-way ANOVA with Dunnett’s multiple comparison test; cycloheximide (CHX, 250 μM, 3 h) was used as a positive control for protein synthesis inhibition.
