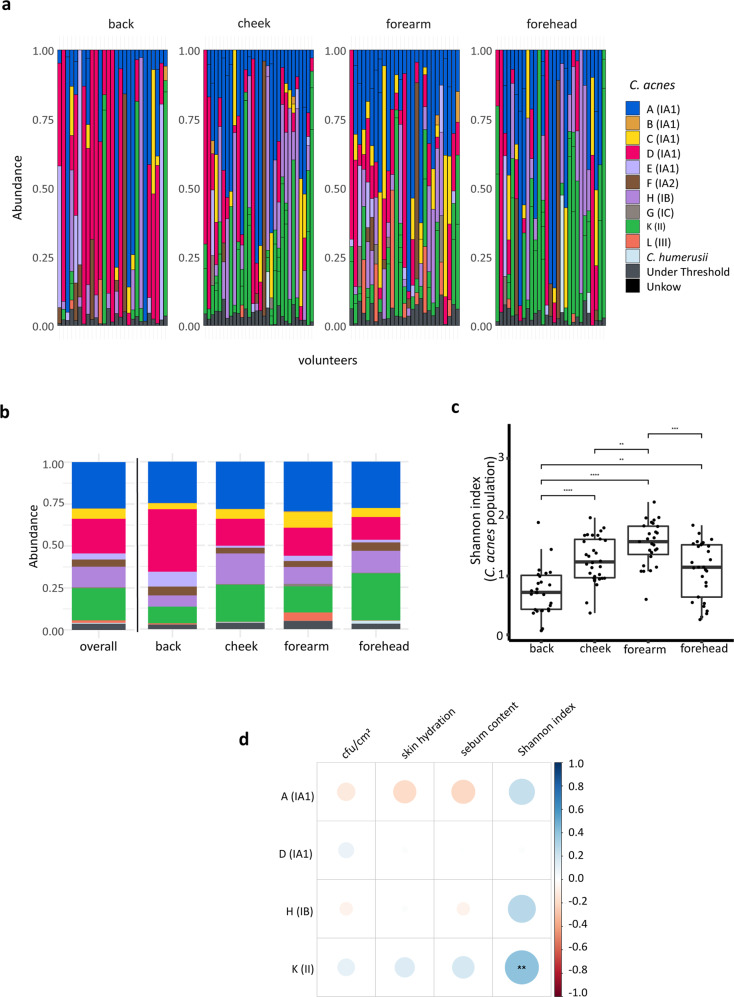
Fig. 4. C. acnes populations in skin samples determined by amplicon-based NGS and correlation to skin parameters.
a 113 out of 120 samples, obtained from 30 volunteers, were positive for the SLST fragment amplification; relative abundances of C. acnes SLST classes of back, cheek, forearm and forehead skin are shown (see also Supplementary Data 3). b Stacked bar plot showing mean values of relative abundances of C. acnes SLST classes overall and for the four skin sites (for colour code see a). c Shannon diversity index of C. acnes populations per skin site (back skin samples, n = 27; cheek skin samples, n = 30; forearm skin samples, n = 27; forehead skin samples n = 29. **p ≤ 0.01, ***p ≤ 0.001, ****p ≤ 0.0001. Unpaired Wilcoxon test). Middle lines of boxplots indicate the median. Lower and upper lines represent the first and third quartiles. Whiskers show the 1.5x inter-quartile ranges. d Spearman correlation between relative abundances of C. acnes SLST classes and skin parameters. The colour code illustrates the correlation coefficient; blue colour represents positive correlation (0 to 1) and red colour inverse correlation (−1 to 0). For instance, the presence of C. acnes class K correlated (statistically significant) with the Shannon index. The correlation analysis is only shown for the four most frequently detected C. acnes SLST classes; correlation analysis for less frequent SLST classes that are detected in relatively few samples is not reliable (FDR-adjusted p-value, **p ≤ 0.01).

