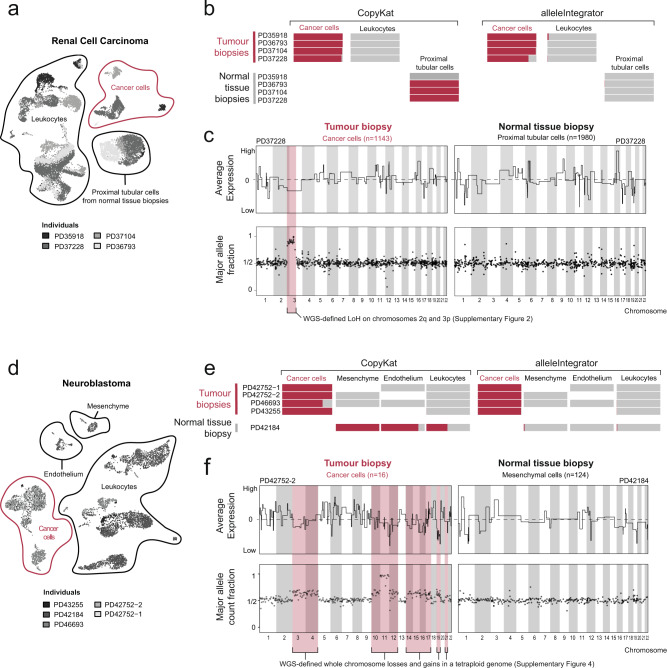
Fig. 2. Comparison of cancer cell annotation and copy-number profile using allelic-ratio and expression-based approaches.
a UMAP of RCC single cell transcriptomes showing patient (shading), cell type (contours and labels), and patient composition (barplots). Inset shows expression of RCC marker CA9. PTC proximal tubular cells derived from normal biopsies. b Cancerous (red) and non-cancerous (grey) cell fraction excluding ambiguous cells by cell type (x-axis) and sample/region (y-axis) called by CopyKAT (left) or alleleIntegrator (right). c Copy-number profile for PD37228 tumour (left) and proximal tubular (right) clusters from normalised averaged expression (top panels, solid black line) and allelic ratio (bottom panel, one dot per bin with ~500 reads), with true copy-number changes from DNA (red shading). d–f As per (a–c) but for neuroblastoma.

