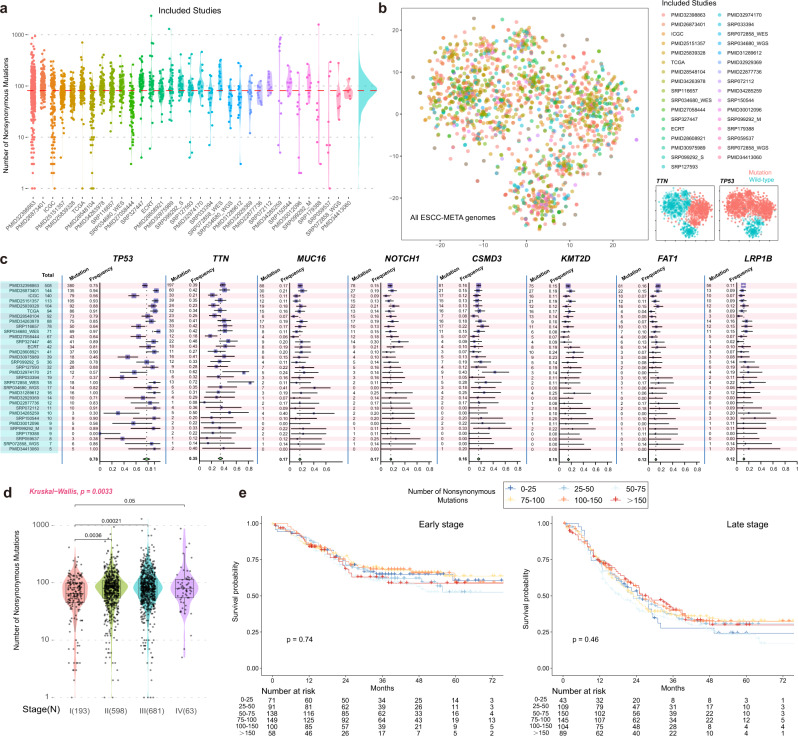
Fig. 1. Overview of the ESCC-MATA cohort.
a All of the included studies and the number of the nonsilent mutations in the ESCC-META cohort. The datasets were ranked by their sample size from left to right. The red horizontal line indicated the median number in overall genomes. b The scatter plot of all genomes by t-SNE analysis. The dots were colored by datasets (left) or mutational status of TTN and TP53 (right). The t-SNE analysis was performed by the mutation matrix of all integrated genomes of the top 1000 genes. c forest plot of the mutational frequency for most common genes in ESCC among all included datasets. The total number of patients in each dataset was labeled in the leftmost panel (blue region). The gene-specific mutated numbers and frequencies in each dataset were presented in the left panel of the gene-specific region. The corresponding forest plots were in the right part. The error band for each line in the forest plot represents the 95% confidence interval of mutational frequency. d Comparison of the mutational load between different tumor stages. All the patients with available stage information were involved in this comparison. The Krustal–Wallis test was used to estimate the significance among the four groups, and the Wilcoxon test was used to estimate the difference in two groups comparison. In the boxplot, the lower extreme line, lower end of box, inner line of box, upper end of box and upper extreme line represent the value of (Q1 − 1.5×IQR), Q1, Q2, Q3 and (Q3 + 1.5×IQR), respectively. Q1—25th quartile; Q2—50th quartile or the median value; Q3—75th quartile. The interquartile range (IQR) is distance between Q1 and Q3 (Q3 − Q1). e Survival comparison between different mutational loads in both early-stage (stage I or II) and late-stage (stage III or IV) patients. All the patients with available stage information were involved in this comparison. The log-rank method was used to estimate the significance. Source data are provided as a Source Data file.

