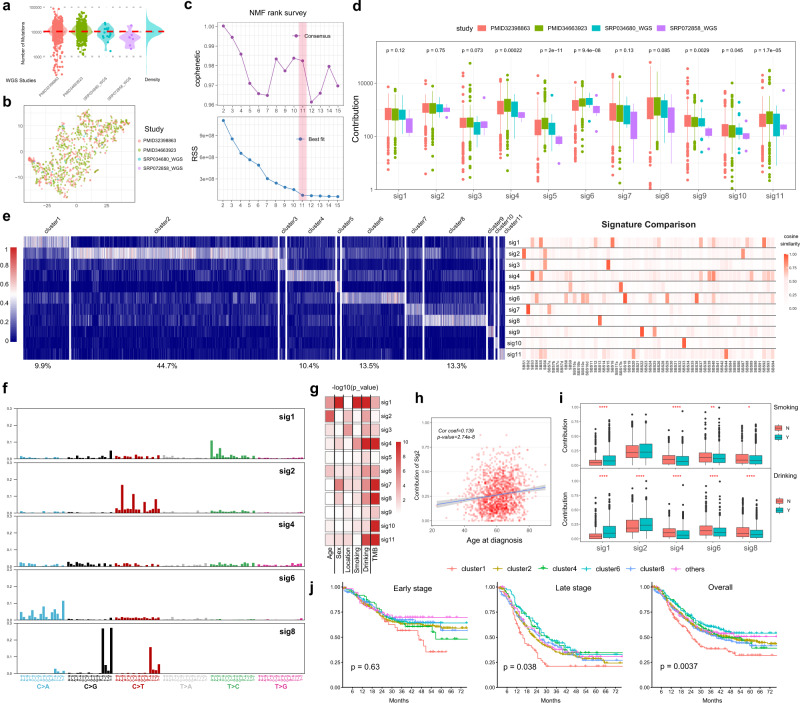
Fig. 2. Mutational signature analysis.
a The distribution of total somatic SNVs in the WGS genomes from four datasets. b The results of the t-SNE analysis. The count matrix of 96 mutational types in WGS samples (n = 1084) was used in the t-SNE analysis, and the dots were colored by the source of dataset. c The NMF rank survey to choose the best separation. The cophenetic correlation coefficient (upper) and the residual sum of squares (lower) were plotted against factorization ranks (from 2 to 15). d The contributions of 11 identified signatures in WGS genomes (discovery set, 1084 patients). e The contributions of the identified 11 signatures in all ESCC-META genome. In the left panel, the patients were ranked according to their major signatures and grouped to 11 clusters. The right panel laid the heatmap of cosine similarity of the 11 signatures to the COSMIC database. f The 96 mutational type features of the sig1, sig2, sig4, sig6, and sig8, which are major mutational signatures in ESCC. g The heatmap of the significance (−log10pvalue) of association between signature contributions and the clinical variables in ESCC-META cohort. The two-side Krustal–Wallis test was used to test the difference among clinical groups. h The contribution of sig2 against the age of diagnosis in ESCC-META cohort. The Pearson’s correlation coefficient and its significance test were used to measure the correlation. The blue line and the gray band represent the fitted regression line and 95% confidence intervals. i In the patients of ESCC-META cohort with available smoking or drinking record, the contributions of major signatures among smoking (upper, n = 1578) or drinking (lower, n = 1484) status. j The overall survival curve of the major clusters in early (n = 607) or late-stage patients (n = 639). The labeled p-values were calculated by log-rank test. In d, g, h, and i, * indicates p < 0.05, **p < 0.01, ***p < 0.001, ****p < 0.0001. In boxplots of d and i, the lower extreme line, lower end of box, inner line of box, upper end of box, and upper extreme line represent the value of (Q1 − 1.5×IQR), Q1, Q2, Q3 and (Q3 + 1.5×IQR), respectively. Q1—25th quartile; Q2—50th quartile or the median value; Q3—75th quartile. The interquartile range (IQR) is distance between Q1 and Q3 (Q3 − Q1). Source data are provided as a Source Data file.

