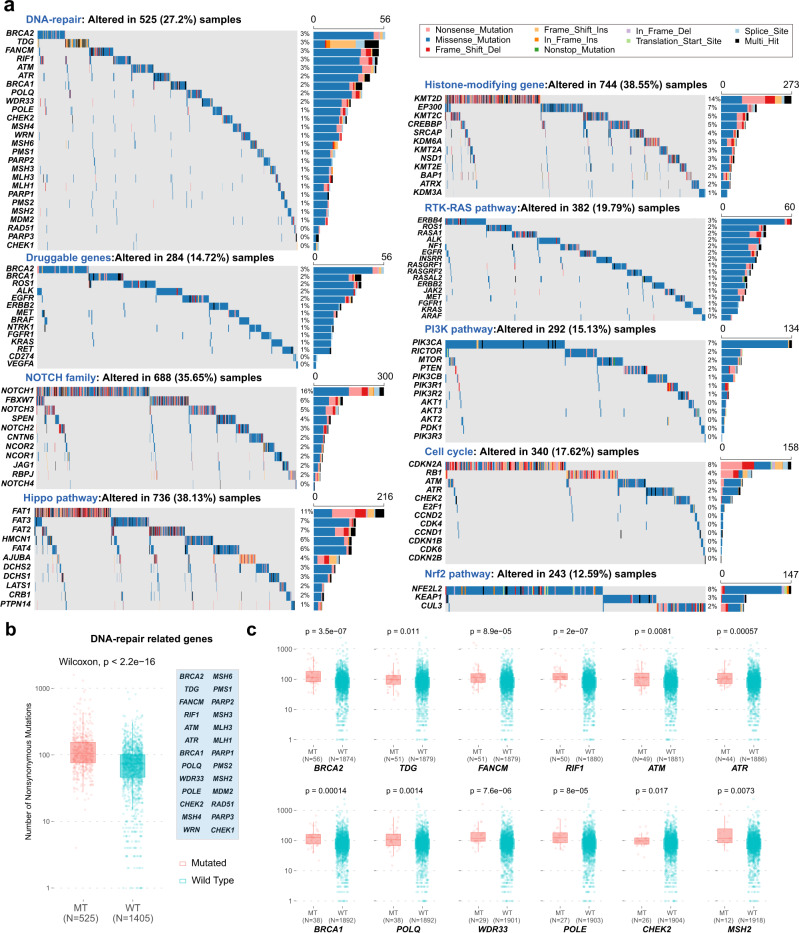
Fig. 3. Summary of altered pathways in ESCC-META.
a The oncoplots of genes in mainly altered pathways. The text above each oncoplot indicates the cumulative altered frequencies among ESCC-META cohort, and the right bar plot indicates the number of mutated patients for each gene. The Multi-Hit (black color) represents two or more nonsilent mutational sites of the specified gene in one patient. b, c Comparison of mutational load between mutational status of DNA-repair pathway-related genes in ESCC-META cohort. The two-side the Wilcoxon test was used to estimate the significance between two groups. In the boxplots (b, c), the lower extreme line, lower end of box, inner line of box, upper end of box, and upper extreme line represent the value of (Q1 − 1.5×IQR), Q1, Q2, Q3 and (Q3 + 1.5×IQR), respectively. Q1—25th quartile; Q2—50th quartile or the median value; Q3—75th quartile. The interquartile range (IQR) is distance between Q1 and Q3 (Q3 − Q1). The effects of single mutated gene are shown in c and the effect of any mutation in the pathway (genes listed in the blue box) is shown in b. Source data are provided as a Source Data file.

