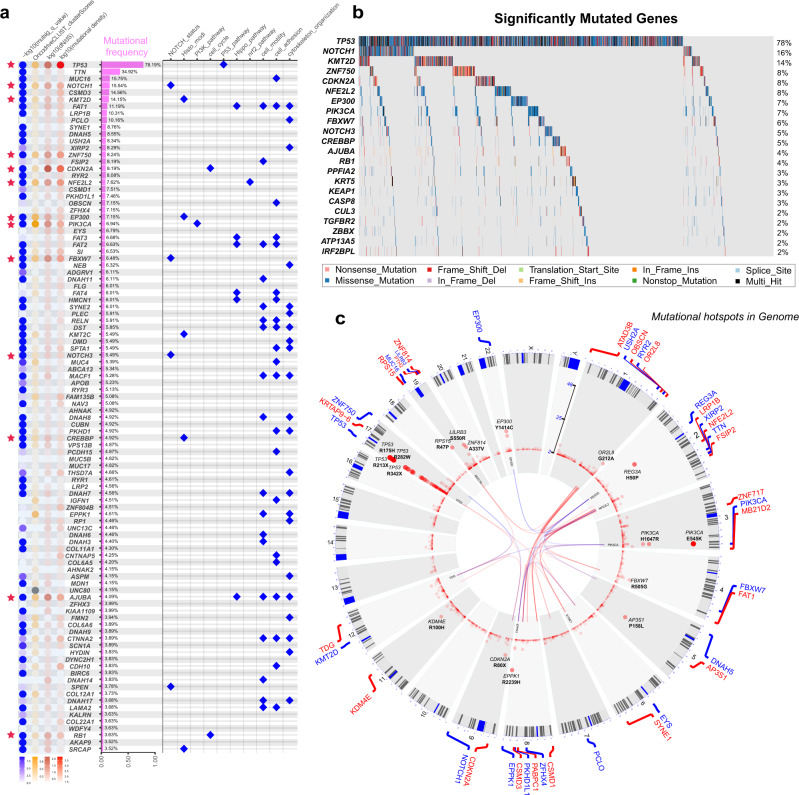
Fig. 4. Significantly mutated genes.
a Summary of the top 100 common mutated genes in the ESCC-META dataset. The dot heat of left panel indicated the mutational importance estimated by four approaches, and the red stars labeled the significantly mutated genes (n = 22) in combined selection. The bar plot of middle panel indicates the mutational frequency. The dot plot of right panel indicates the major related pathway. b The oncoplot of the 22 significantly mutated genes in ESCC-META cohort. c The circle chart to indicate the recurrent SNVs in ESCC-META cohort. Each point represented one recurrent mutational site in genome, and the relative height indicate the recurrent frequency. The inner part of the circle linked the significant interactions of gene-pairs, in which the blue links indicated mutually exclusive patterns and the red links indicated co-occurring patterns. Source data are provided as a Source Data file.

