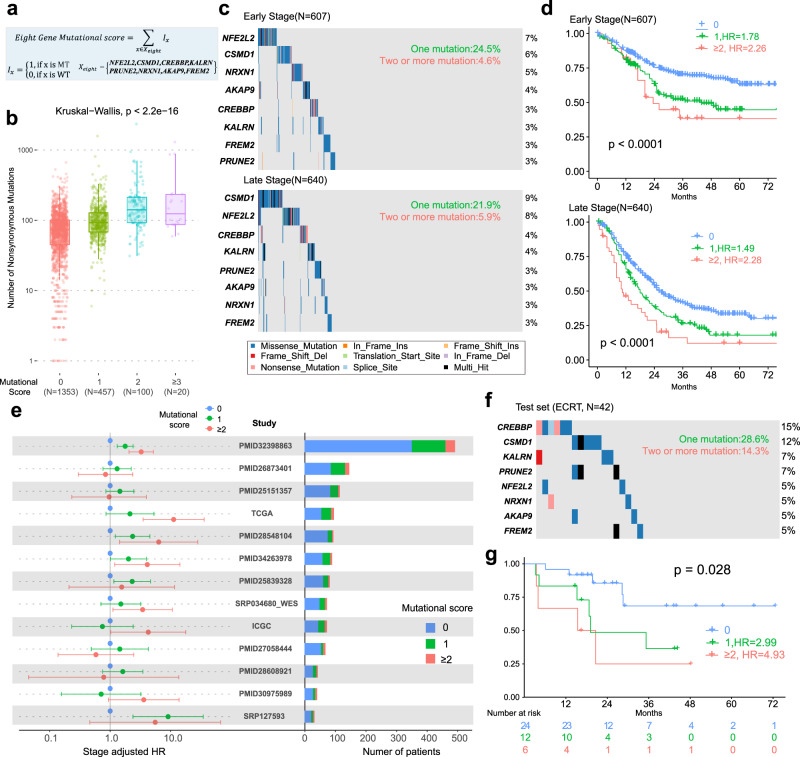
Fig. 7. Building of eight-gene mutational score.
a The formula definition of the eight-gene mutational score. WT wide type, MT mutation. b The comparison of mutational load among different mutation score in all ESCC-META genomes, the two-side Krustal–Wallis test was used to estimate the significance among the groups. In the boxplots, the lower extreme line, lower end of box, inner line of box, upper end of box, and upper extreme line represent the value of (Q1 − 1.5×IQR), Q1, Q2, Q3 and (Q3 + 1.5×IQR), respectively. Q1—25th quartile; Q2—50th quartile or the median value; Q3—75th quartile. The interquartile range (IQR) is distance between Q1 and Q3 (Q3 − Q1). c Oncoplots of the eight genes in mutational score within early-stage patients (upper) or late-stage patients (lower) of discovery set. d The survival comparison between different mutational scores within early-stage patients (upper, n = 607) or late-stage patients (lower, n = 640) of discovery set. The two-side log-rank test was used to indicate the significance. e The prognostic value of mutational score within separated dataset. The left panel indicates the stage-adjusted HR of mutational score with the 95% confidence interval (the dot and error bar). The left panel indicates the total and positive number in each dataset. f The oncoplot of the eight genes in mutational score within test set of ECRT (n = 42). g The survival comparison between different mutational scores within test set. The two-side log-rank test was used to indicate the significance. Source data are provided as a Source Data file.

