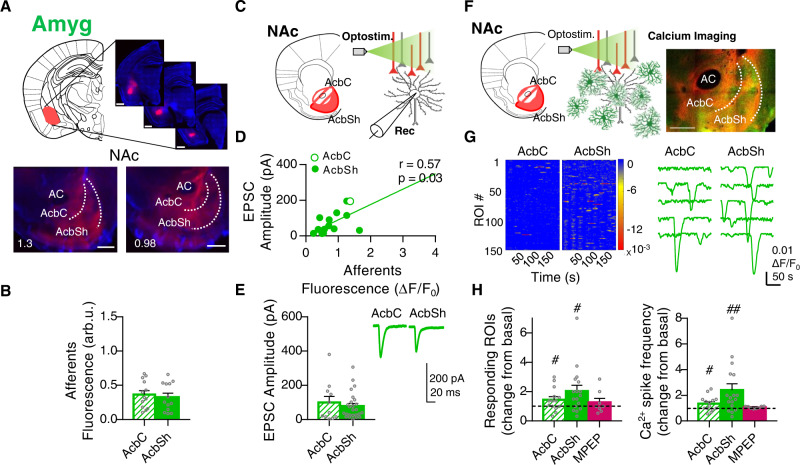
Fig. 4. Pathway-specific nucleus accumbens (NAc) astrocyte activity in response to basolateral amygdala (Amyg) afferents.
A Scheme and representative slices showing opsin expression (ChrimsonR-tdTom) after AAV injection into the Amyg (top; scale bar = 1 mm) and their tdTom-expressing afferents to the NAc (bottom; scale bar = 500 µm). B Quantification of Amyg afferents fluorescence (arb.u.) in accumbens core (AcbC; slashed bar) and accumbens shell (AcbSh; solid bar) (13 infections, 7 mice). Two-tailed unpaired t test Welch-corrected, P = 0.63. C Scheme of NAc neuron’s electrophysiological recordings in response to Amyg afferent’s optostimulation. D Positive correlation between NAc neuron’s response (pA) and Amyg afferents’ density (ΔF/F0 in the area of register) (15 cells, 2 mice). E EPSC amplitude (pA) quantification (left) from AcbC (slashed bar; 11 cells, 3 mice) and AcbSh neurons (solid bar; 25 cells, 2 mice), and representative EPSCs traces (right) showing the synaptic neuronal strength triggered by Amyg in each subregion. Two-tailed unpaired t test, P = 0.54. F Scheme of astrocytic Ca2+ dynamics monitored by real-time imaging of CaMPARIGFAP green fluorescence, in response to Amyg afferent’s optostimulation. Representative NAc slice (right) showing ChrimsonR-tdTom Amyg afferents (red) and CaMPARIGFAP astrocytes (green). Scale bar = 500 µm. G Heatmaps (left; 150 ROIs, 3 slices) showing Ca2+ activity vs time and representative Ca2+ traces (right), in response to Amyg optostimulation. H Relative quantification of ROIs response (left) and Ca2+ spike frequency (right) induced by Amyg afferent’s optostimulation in control condition, at AcbC (slashed bar; 14 slices, 7 mice) and AcbSh (solid bar; 17 slices, 7 mice). Subsets of those ROIs were registered in the presence of the selective mGluR5 antagonist (MPEP, 50 µM; magenta bars; AcbC and AcbSh pooled together, 5 slices, 2 mice). One-sample t test, #P < 0.05; ##P < 0.01; one-way ANOVA, Holm–Sidak test for multiple comparisons, P > 0.05. For more statistical detail, see Supplementary Table 1. Error bars express SEM. Source data are provided as a Source Data file.

