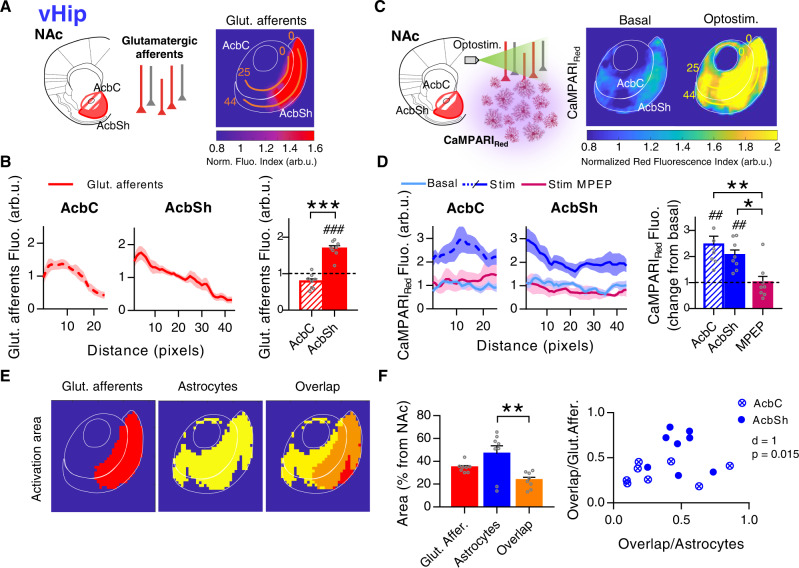
Fig. 7. Spatial nucleus accumbens (NAc) astrocytic response to ventral hippocampus (vHip) afferents.
A Left, scheme of opsin-transfected vHip afferents in the NAc. Right, average PRQ image showing vHip glutamatergic innervation pattern. Orange lines starting from pixel 0 in each subregion were used for quantification (pixel = 50 µm2). B Left, glutamate afferents fluorescence (arb.u.) vs distance (pixels) quantifying vHip innervation across orange lines. Right, average glutamate afferents spatial fluorescence (arb.u.) in the accumbens core (AcbC; slashed bar) and accumbens shell (AcbSh; solid bar) (8 slices, 6 mice). One-sample t test, ###P < 0.001; two-tailed unpaired t test, ***P < 0.001. C Left, scheme of astrocytic Ca2+ activity, measured by CaMPARIGFAP red, in response to vHip afferent’s optostimulation. Right, average PRQ image showing astrocytic activation pattern in the NAc in basal and optostimulated conditions. Yellow lines starting from pixel 0 in each subregion were used for quantification (pixel = 50 µm2). D Left, CaMPARIRed fluorescence (arb.u.) vs distance (pixels) quantifying astrocytic activation across yellow lines. Right, relative average CaMPARIRed spatial fluorescence (arb.u.) in optostimulated condition in control, at AcbC (slashed bar) and AcbSh (solid bar) (8 pairs basal-stim slices, 6 mice), and in presence of MPEP (magenta bar; AcbC and AcbSh pooled together, 4 pairs basal-stim slices, 2 mice). One-sample t test, ##P < 0.001; one-way ANOVA, Holm–Sidak test for multiple comparisons, *P = 0.02; **P = 0.002. E Masks of vHip glutamatergic afferents (red) and astrocyte activation area (yellow) defined by a k-mean clustering. In orange, the overlap area between the two. F Left, area (% from NAc) quantification of the spatial overlap (orange bar) between vHip afferents (red bar; P = 0.12) and active astrocytes (blue bar; **P = 0.003) (8 slices, 6 mice). One-way ANOVA, Holm–Sidak test for multiple comparisons. Right, bivariance index showing overlap distributions of AcbC and AcbSh. Note that AcbSh overlap area is embedded within the afferent’s area (Overlap/Glut. Affer. close to 1), indicating a direct interaction between vHip axons and astrocytes not present in AcbC. MANOVA test. Error bars express SEM. Source data are provided as a Source Data file.

