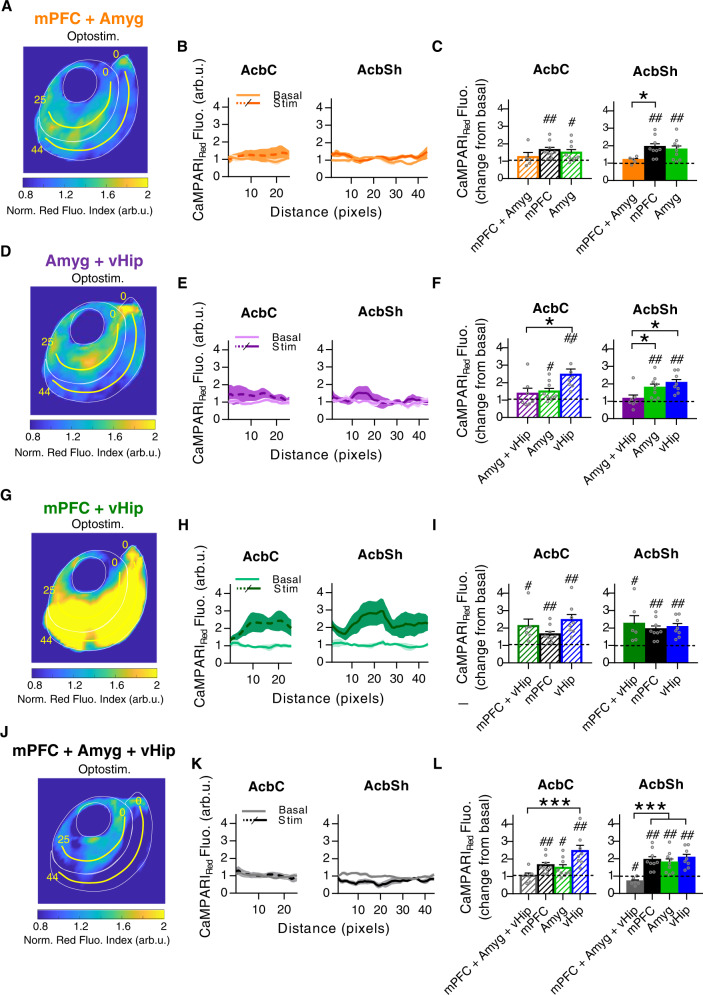
Fig. 9. Integrative properties of nucleus accumbens (NAc) astrocytes in response to co-stimulation of glutamatergic pathways.
A Average PRQ image showing astrocytic activation pattern in NAc in response to co-stimulation of mPFC and Amyg afferents. B CaMPARIRed fluorescence (arb.u.) vs distance (pixels) quantifying astrocytic activation across yellow lines. C Average CaMPARIRed spatial fluorescence (arb.u.) in co-stimulated condition vs basal in AcbC and AcbSh (mPFC + Amyg, orange; 5 pairs basal-stim slices, 3 mice), compared to individual mPFC (black) and Amyg (green) response. D Average PRQ image showing astrocytic activation pattern in NAc in response to co-stimulation of Amyg and vHip afferents. E CaMPARIRed fluorescence (arb.u.) vs distance (pixels) quantifying astrocytic activation across yellow lines. F Average CaMPARIRed spatial fluorescence (arb.u.) in co-stimulated condition vs basal in AcbC and AcbSh (Amyg + vHip, purple; 7 pairs basal-stim slices, 4 mice), compared to individual Amyg (green) and vHip (blue) response. G Average PRQ image showing astrocytic activation pattern in NAc in response to co-stimulation of mPFC and vHip afferents. H CaMPARIRed fluorescence (arb.u.) vs distance (pixels) quantifying astrocytic activation across yellow lines. I Average CaMPARIRed spatial fluorescence (arb.u.) in co-stimulated condition vs basal in AcbC and AcbSh (mPFC + vHip, dark green; 6 pairs basal-stim slices, 5 mice), compared to individual mPFC (black) and vHip (blue) response. J Average PRQ image showing astrocytic activation pattern in NAc in response to mPFC, Amyg and vHip co-stimulation. K CaMPARIRed fluorescence (arb.u.) vs distance (pixels) quantifying astrocytic activation across yellow lines. L Average CaMPARIRed spatial fluorescence (arb.u.) in co-stimulated condition vs basal in AcbC and AcbSh (mPFC + Amyg + vHip, gray; 6 pairs basal-stim slices, 3 mice), compared to individual mPFC (black), Amyg (green) and vHip (blue) response. Yellow lines starting from pixel 0 were used for quantification (pixel = 50 µm2). One-sample t test, #P < 0.05; ##P < 0.01 and one-way ANOVA, Holm–Sidak test for multiple comparisons, *P < 0.05; ***P < 0.001. For more statistical detail, see Supplementary Table 1. Error bars express SEM. Source data are provided as a Source Data file.

