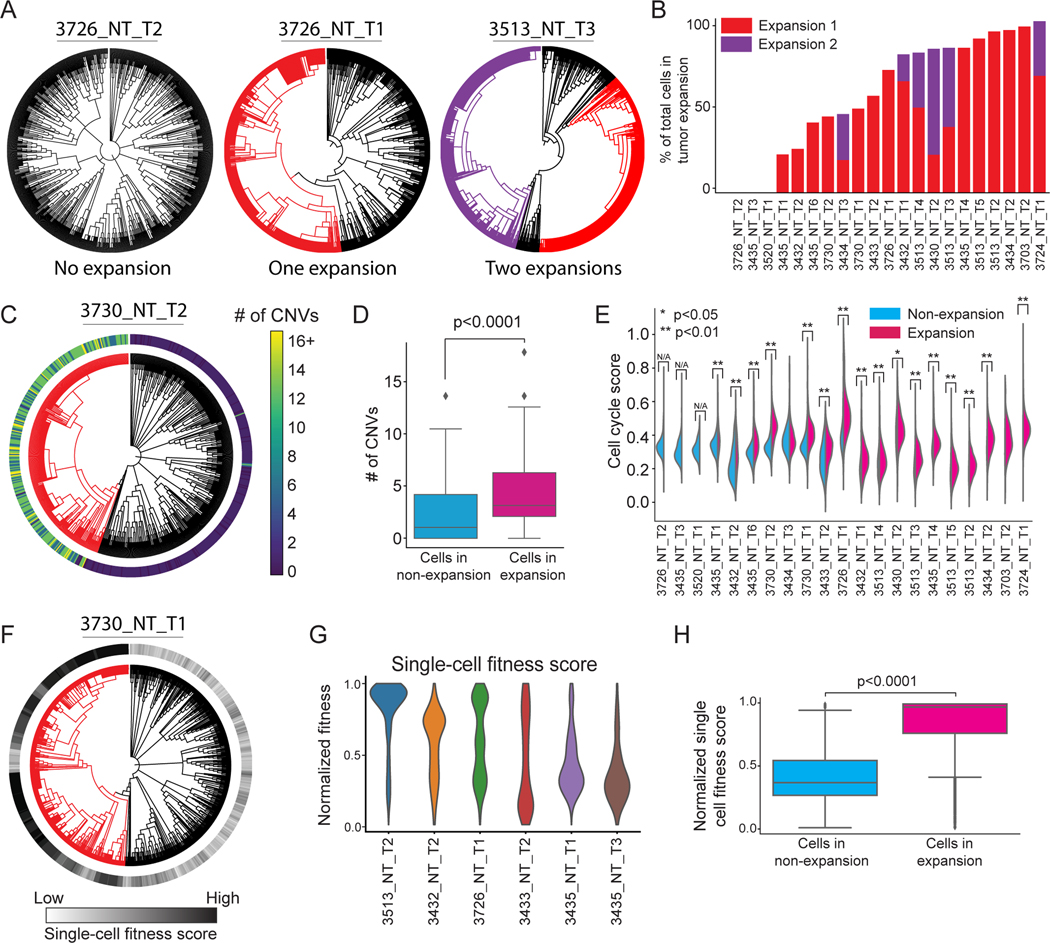
Figure 2. Rare subclones expand during tumor progression, marked by increased DNA copy number variation, cell cycle score, and fitness score.
(A) Example tumor phylogenies with expansions highlighted with red or purple branches. (B) The number of expansions and percentage of expanding cells across tumors. Tumors are ranked by the total percentage of cells in expanding subclones. (C) CNV numbers per cell (outer bar) in expanding (red) versus non-expanding (black) cells of an example tumor. (D) Comparison of CNV number per cell in expansions versus non-expansions (Permutation test, p<0.0001). (E) Comparison of cell cycle transcriptional scores of cells from the expanding and non-expanding subclones (two-sided Mann-Whitney U test, * p<0.05, ** p<0.01). Tumors without expansions are labeled as N/A. (F-H) Phylogenetic single-cell fitness scores in expansions. (F) A representative tumor phylogeny with single-cell fitness scores overlaid. (G) Single cell fitness scores in representative tumors. (H) Cancer cells from expansions have significantly higher single-cell fitness scores (two-sided Mann-Whitney U test, p < 0.0001).
See also Figure S2.

