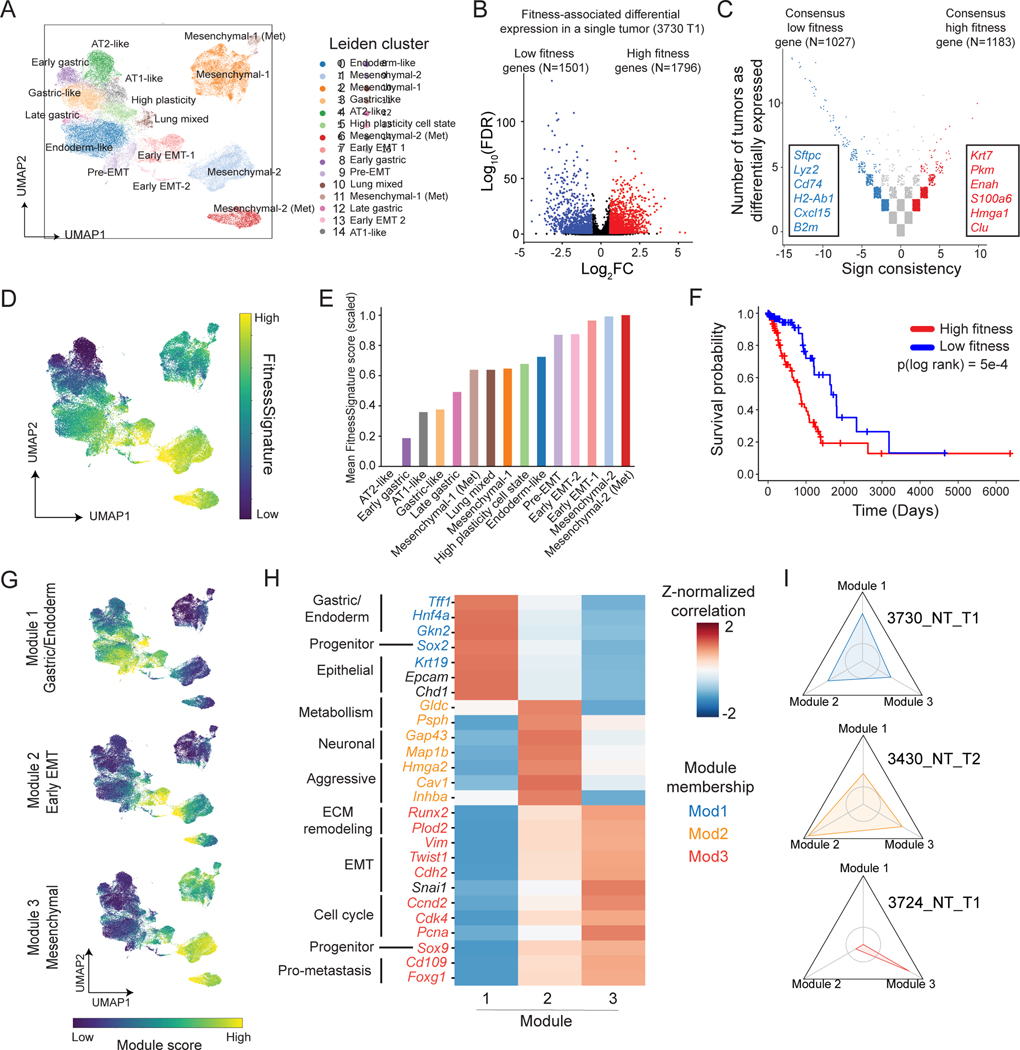
Figure 3. Integration of phylodynamics and transcriptome uncovers fitness-associated gene programs for KP tumors.
(A) Gene expression UMAP and clustering of cancer cells from KP-Tracer tumors. (B-C) Identification of a transcriptional FitnessSignature. (B) Differential expression analysis identifies genes positively (red) and negatively (blue) associated with single-cell fitness (C) Meta-analysis of fitness-associated genes across all KP tumors. (D) Gene expression UMAP annotated by individual cells’ single cell FitnessSignature scores (normalized to a 0–1 scale). (E) Average FitnessSignature scores of each Leiden cluster (normalized to 0–1). Colors reflect the Leiden clusters in (A). (F) Kaplan-Meier survival analysis of TCGA lung adenocarcinoma patients (n=495) stratified into high (red) and low (blue) groups based on gene expression of the derived transcriptional FitnessSignature. (Log-rank test, p=5e-4). (G) Gene expression UMAP annotated with transcriptional scores of the three fitness gene modules. (H) Heatmap of Z-normalized Pearson’s correlations between marker gene expression and fitness module scores for selected differentially expressed genes with manual annotations. Genes are colored by assigned fitness gene module; genes in black indicate helpful markers that did not appear in a fitness module. (I) Personality plots of three representative tumors displaying the fold change in fitness module scores of individual expansions compared to the non-expanding regions. Vertices indicate individual fitness modules. Axes are normalized to 0.4 – 2.2-fold change observed across tumors. Inner circle represents a fold change of 1 (no change) and values greater than 1 indicate the cells in expansions exhibiting enriched usage of the particular fitness gene module. Colors (see (H)) reflect the module a tumor expansion is characterized by.

