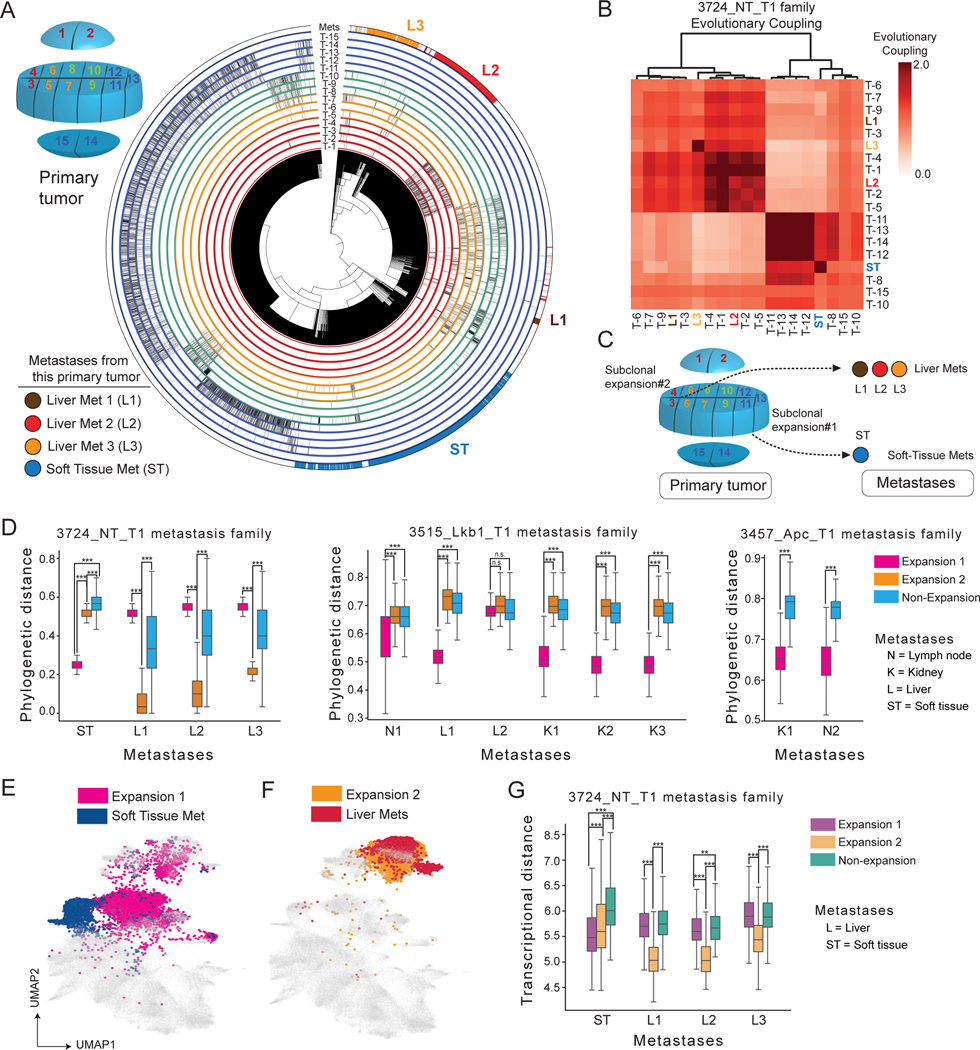
Figure 7. Metastases originate from spatially localized, expanding subclones of primary tumors.
(A) Multi-region analysis of tumor-metastasis family 3724_NT_T1. Top left inset showed the relative spatial location of tumor pieces. The phylogeny of the primary tumor and metastases is annotated via peripheral radial tracks for each color-coded region of the tumor (matching the inset) and four metastases. (B) Heatmap of Evolutionary Couplings of primary tumor pieces (black) and 4 related metastases (matching colors in (A)) from the 3724_NT_T1 tumor-metastasis family.
(C) Summary of the spatial-phylogenetic relationship of the tumor-metastasis family 3724_NT_T1. (D) Single-cell phylogenetic distance of each metastasis to the non-expanding and expanding subclones in its related primary tumor. Each box represents the distribution of phylogenetic distances from a metastasis to a defined region of its related primary tumor (one-sided Mann-Whitney U test are indicated: ***p<0.0001, n.s. = not significant). (E-F) Gene expression UMAP annotated by metastases and their original subclones in 3724_NT_T1. Cells that are not relevant to the comparison in each panel are shown in gray. (G) Transcriptional distances between expanding regions of 3724_NT_T1 and its four metastases (one-sided Mann-Whitney U test are indicated: **p < 0.001, ***p<0.0001).
See also Figure S7.

