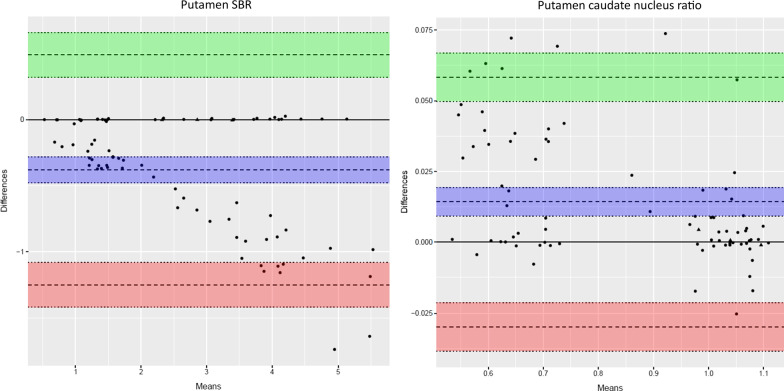
Fig. 4.
Short versus longer acquisition protocol. Bland–Altman plots of 17–42-min reconstructions versus 30–40-min reconstructions for same patients as in Fig. 3. Triangles represent patients with discrepancy between PET and SPECT reading. The purple area represent the mean difference with 95% confidence limits (C.I.), the green area represent the upper limit of agreement with 95% C.I., and the red area the lower limit of agreement. Please note the relative higher values for putamen SBR (left) using the shorter reconstruction with 95% of patients being within 25% difference. Putamen/caudate nucleus ratio (right) show similarly relatively higher values but the difference is smaller and within 10%. The difference stress the need for using the same acquisition protocol in a future normal database for comparison

