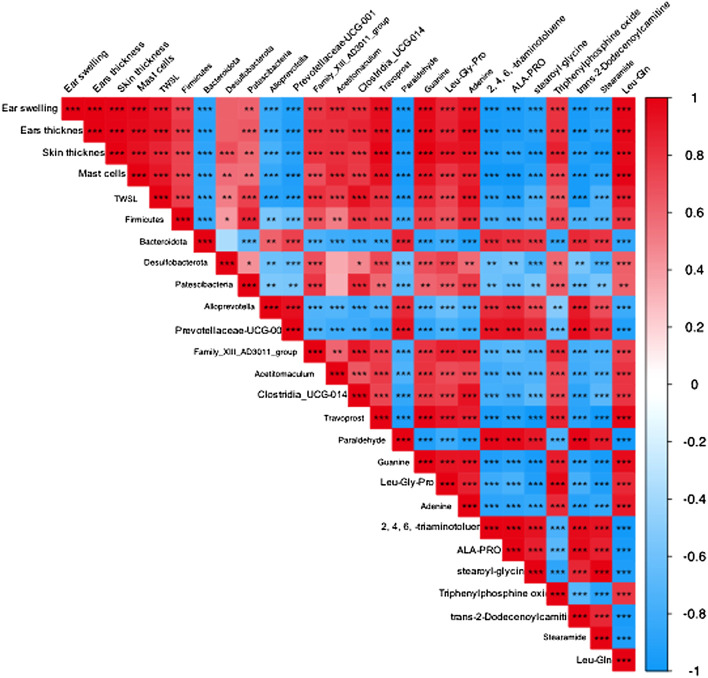
FIGURE 12.
Correlation among AD symptoms, relative abundance of gut bacterial and metabolite changes. The correlation was determined using the Spearman’s rank correlation analysis. The red color indicates positive correlation, and the blue color indicates negative correlation. ∗p < 0.05, ∗∗p < 0.01, ∗∗∗p < 0.001.

