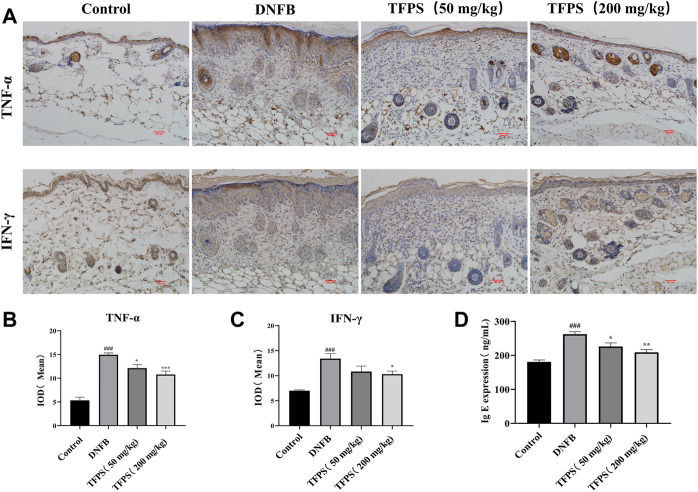
FIGURE 4.
Effect of oral administration of TFPS on cytokine expression in the dorsal skin of AD mice. (A) The IHC results of TNF-α and IFN-γ in kidney of Control, DNFB and TFPS(50 or 200 mg/kg) groups (magnification ×200) (B) Mean IOD of TNF-α group. (C) Mean IOD of IFN-γ IHC in each group. (D) Determination of serum IgE level in each test group. All values are represented as means ± S.E.M (n = 3). ###p < 0.001, compared with Control group. ∗p < 0.05, ∗∗p < 0.01, ∗∗∗p < 0.001, compared with DNFB group.

