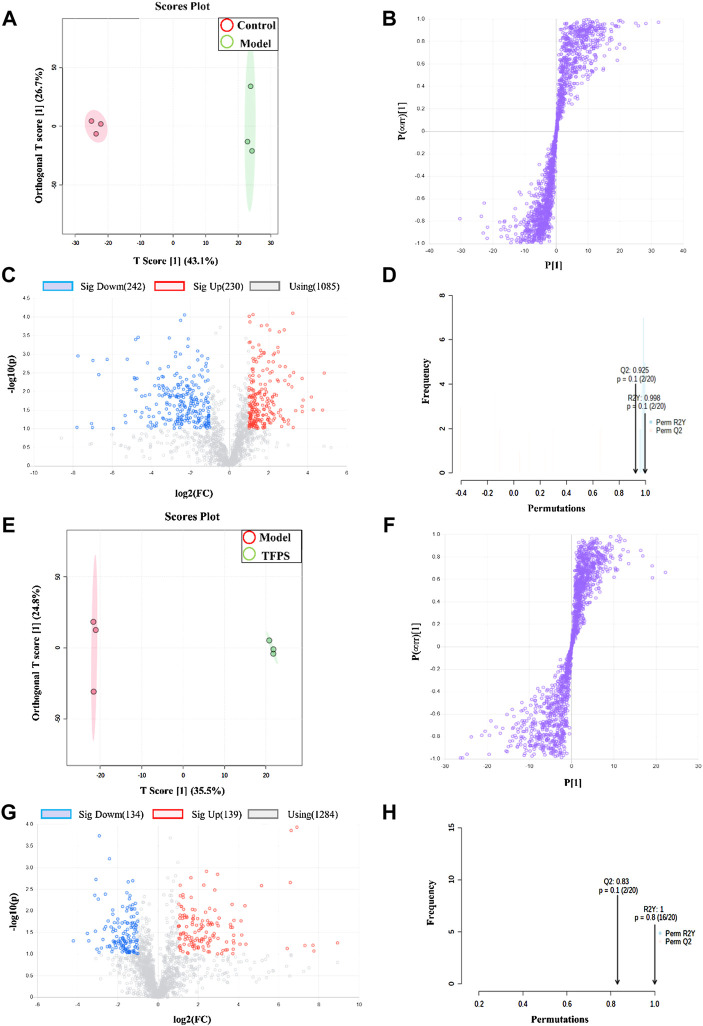
FIGURE 9.
OPLS-DA analysis on experimental groups. (A) OPLS-DA score chart for control and model groups. (B) Statistically verified scatter plot was obtained through 2000X replacement test for control and model groups. (C) OPLS-DA S-plot of metabolic profiling for control and model groups. (D) Volcano chart by the OPLS-DA analysis for control and model groups. (E) OPLS-DA score plot for model and TFPS groups. (F) Statistically verified scatter plot was obtained by 2000X permutation test for model and TFPS groups. (G) OPLS-DA S-plot of metabolic profiling for model and TFPS groups. (H) Volcano plot for model and TFPS groups.

