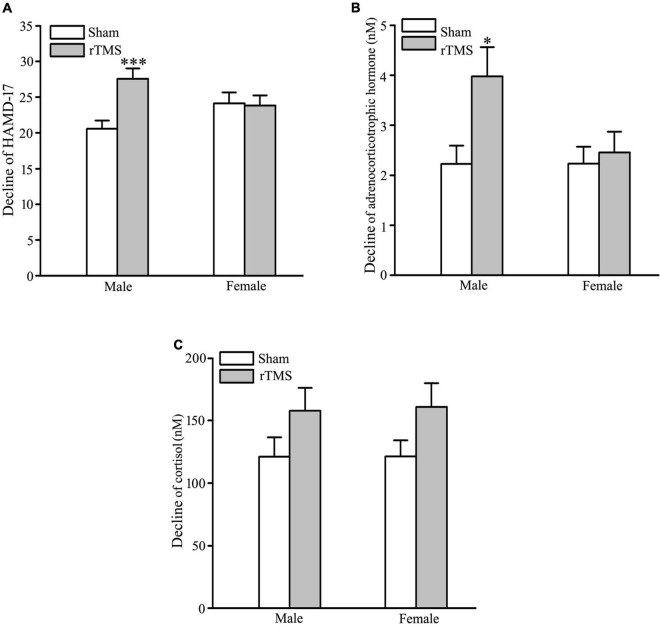
FIGURE 4.
Gender-specificity of repetitive transcranial magnetic stimulation (rTMS) on depressive symptom and hypothalamic–pituitary–adrenal (HPA) axis. (A) Change in the total score of 17 items Hamilton depression rating scale (HAMD-17) from baseline to post-intervention at 4 weeks in male and female patients. (B,C) Change in the concentration of adrenocorticotropic hormone (ACTH) (B) and cortisol (COR) (C) from baseline to post-intervention at 4 weeks in male and female patients. rTMS group significantly different from the sham group was marked by asterisks. *p < 0.05, ***p < 0.001, compared with the sham group. Graphs show mean ± SEM; n = 68.

