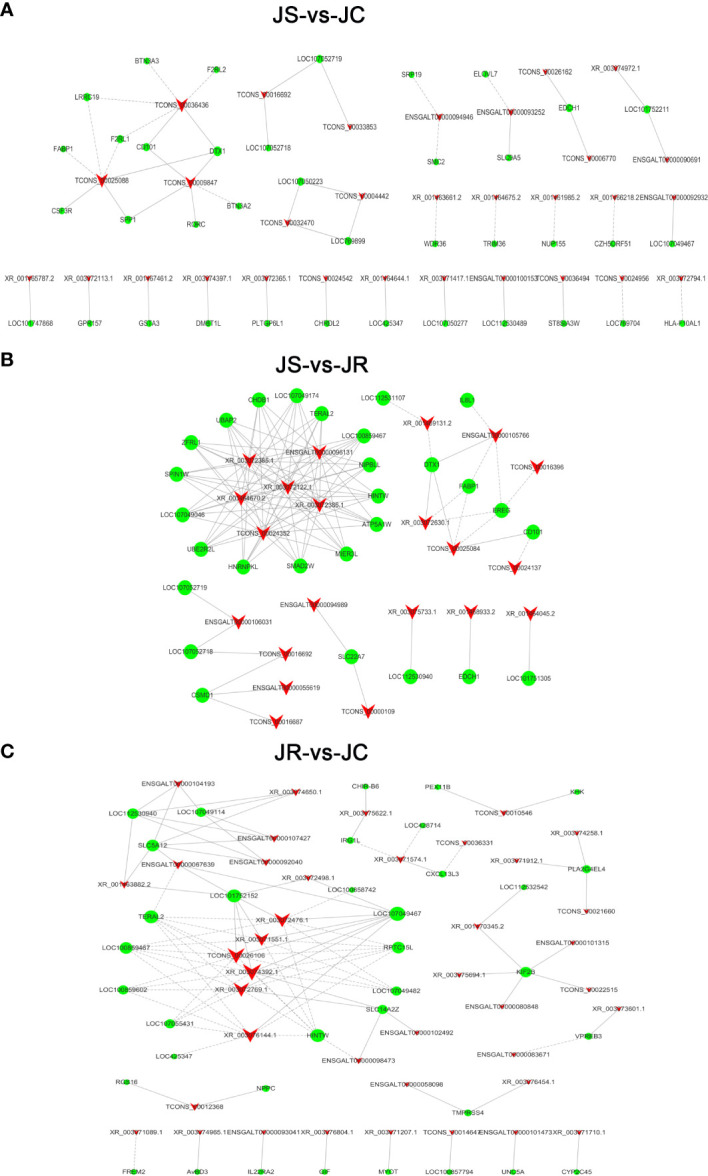
Figure 6.

The coexpression network of differentially expressed lncRNAs and mRNAs. (A) JS vs JC groups. (B) JS vs JR groups. (C) JR vs JC groups. The solid lines indicate positive correlations, the dashed lines indicate negative correlations, the triangles represent the lncRNAs, and the circles represent the mRNAs.
