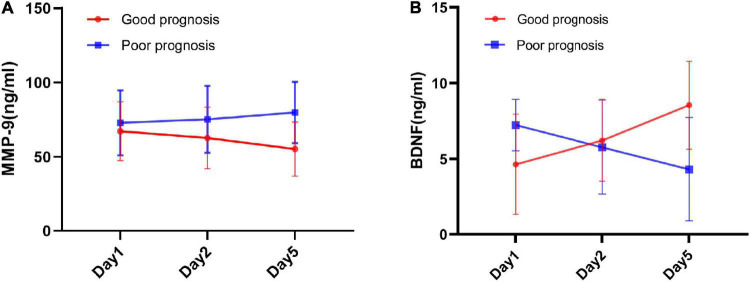
FIGURE 3.
The longitudinal changes of MMP-9 and BDNF over the acute stage of ischemic stroke between good prognosis group and poor prognosis group. (A) Mean serum MMP-9 levels changes at Day 1, Day 2, and Day 5 time points between good prognosis group and poor prognosis group. (B) Mean serum BDNF levels at Day 1, Day 2, and Day 5 time points between good prognosis group and poor prognosis group. Error bars indicate 95% CI of the mean.

