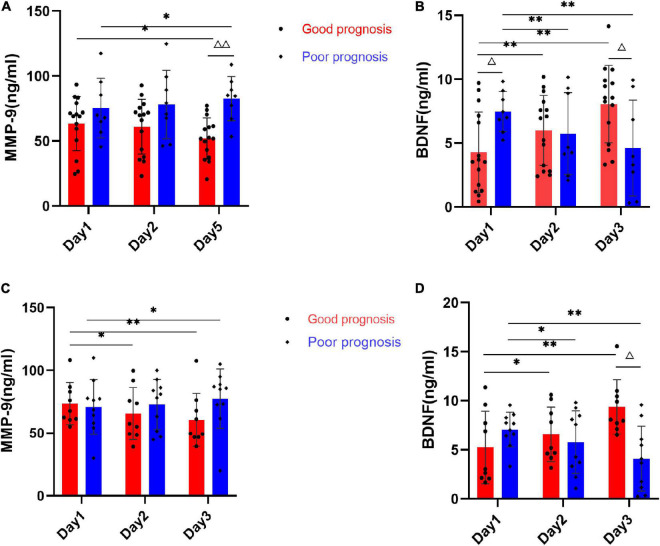
FIGURE 4.
Average serum MMP-9 and BDNF levels of AIS patients with or without thrombolysis at Day 1, Day 2, and Day 5 time points. (A) Bar graph shows quantitative analysis for serum MMP-9 of patients with non-thrombolysis between good prognosis group (n = 15) and poor prognosis group (n = 8). (B) Bar graph shows quantitative analysis for serum BDNF of patients with non-thrombolysis between good prognosis group (n = 9) and poor prognosis group (n = 10). (C) Bar graph shows quantitative analysis for serum MMP-9 of patients with thrombolysis between good prognosis group (n = 15) and poor prognosis group (n = 8). (D) Bar graph shows quantitative analysis for serum BDNF of patients with thrombolysis between good prognosis group (n = 9) and poor prognosis group (n = 10). Data represent as mean ± SD, *P < 0.05, **P < 0.01 vs. Day 1 time points, ΔP < 0.05, ΔΔP < 0.01 vs. group with good prognosis.

