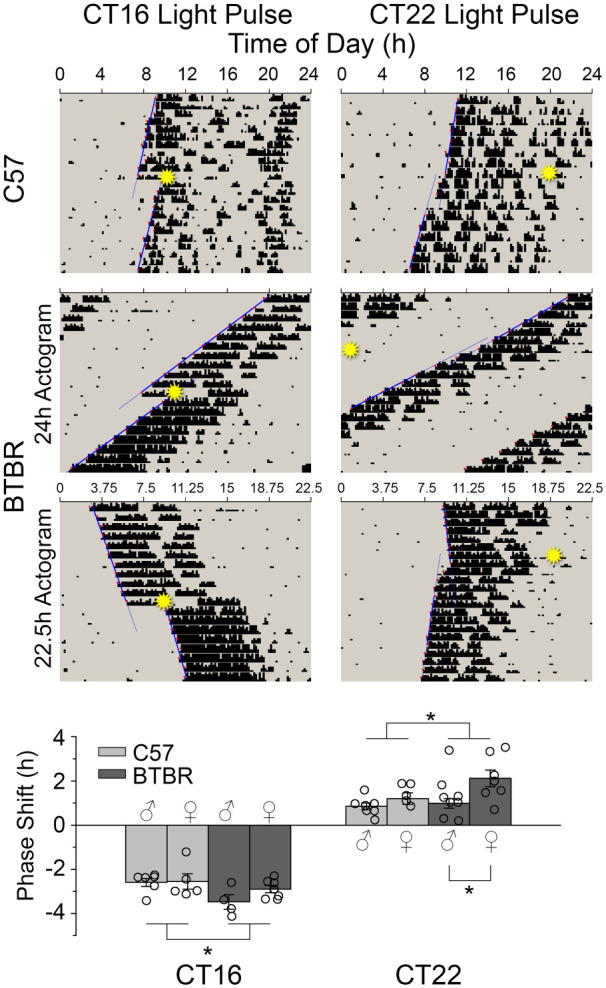
Figure 2.

Representative actograms showing phase shift responses to early (CT16) and late (CT22) 15 min light pulses (indicated by star) in C57 and BTBR mice. Lines represent the regression lines fitted to activity onset before the light pulse and from days 3 to 10 after. The difference between the two represents the phase shift. BTBR mice had comparable phase advances but larger phase delays when compared to C57 mice.
*p < 0.05.
