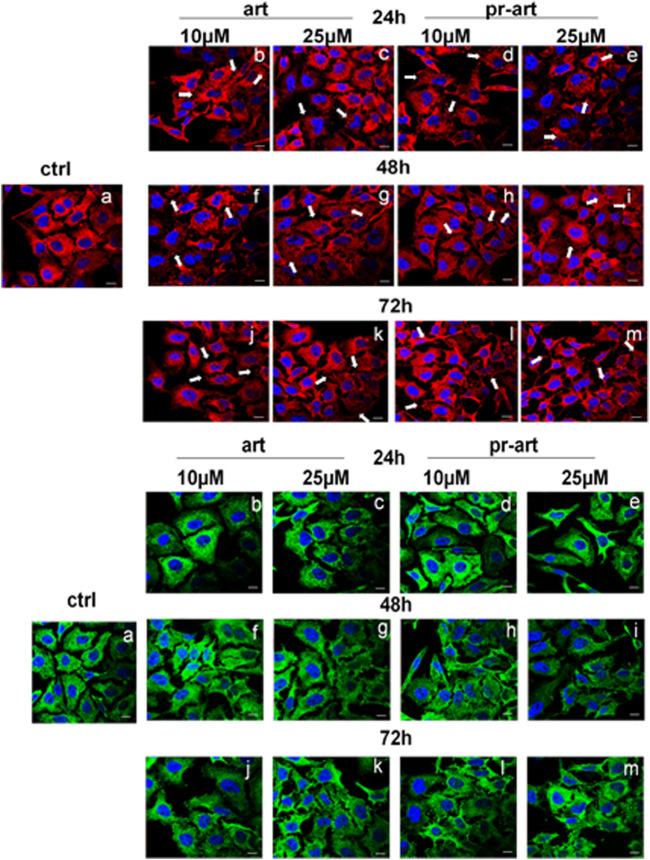
FIGURE 5.
lmmunofluorescence analysis of ART and 8-p-ART-treated (10 and 25 μM; from 24 to 72 h) HeLa cells. These ones were fixed and labeled with an antibody against FLNA (red) and FLNB (green). White arrows show FLNA and FLNB disorganization. Magnification: ×63 1.4 NA. Bar = 100 µm. All images are representative fields of n = 3 experiments with similar results.

