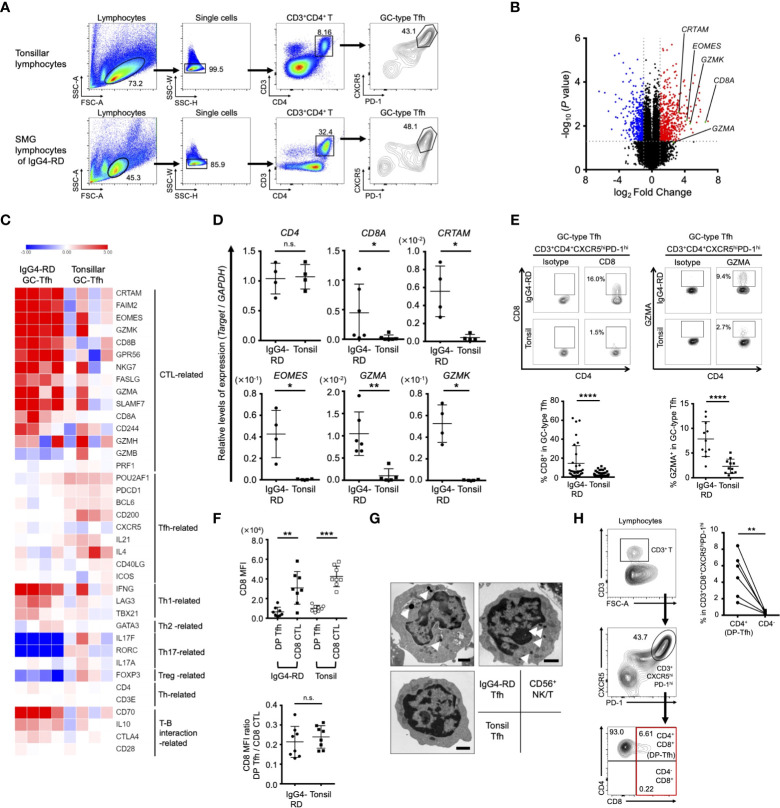
Figure 1.
Phenotypic characteristics of GC-type Tfh cells in IgG4-RD lesions. (A) Flow cytometry profiles showing selected windows and gating strategy applied to identify GC-type Tfh cells (CD3+CD4+CXCR5hiPD-1hi) in lymphocytes of tonsils and SMG lesions of IgG4-RD. (B) Volcano plot identifying differentially expressed genes (p < 0.05) with more than two-fold expression in GC-type Tfh cells localized in SMG lesions of IgG4-RD versus GC-type Tfh cells in tonsils. The red and blue dots indicate upregulated and downregulated genes, respectively, in the Tfh cells of IgG4-RD. Data were obtained from microarray analysis of four specimens in each experiment group of IgG4-RD lesions or tonsils. (C) Heat map indicating relative abundances of transcripts identified in (A) for selected genes regulating helper CD4+ T cells and CTLs. Relative values of gene expression are indicated by color. (D) Relative expression levels of genes in GC-type Tfh cells in the SMG lesions of IgG4-RD and tonsils as indicated in (C) assessed by RT-qPCR analysis. GAPDH was used as a control (IgG4-RD, n = 4-6; tonsil, n = 4-6). (E) Representative flow cytometry profiles of the expression of CD8 and granzyme A (GZMA) in GC-type Tfh cells in SMG lesions of IgG4-RD and tonsils (upper panels). Graphs indicating the expression of CD8 (IgG4-RD, n = 31; tonsil, n = 71) and GZMA (IgG4-RD, n = 11; tonsil, n = 11) in GC-type Tfh cells as assessed by flow cytometry (lower panels). (F) Expression levels of CD8 on DP-Tfh cells and CD8+ CTLs in the lymphocytes of IgG4-RD lesions and tonsils (IgG4-RD, n = 8; tonsil, n = 8) assessed by flow cytometry. MFI, mean fluorescence intensity. (G) Transmission electron microscopy of FACS-sorted T cells, including GC-type Tfh cells from SMG lesions of IgG4-RD and tonsils and NKT cells (CD3+CD56+) from tonsils. Arrowheads indicate electron-dense granules in the cytosol. Scale bar: 1 μm. (H) DP-Tfh cells enriched in the CD3+CD8+CXCR5hiPD-1hi T cell population in tonsils. Representative flow cytometry profiles to detect DP-Tfh cells and CD3+CD4-CD8+CXCR5hiPD-1hi T cells as indicated in the red square (left panels). A graph showing the CD3+CD8+CXCR5hiPD-1hi T cell population preferentially containing DP-Tfh cells (right). Data from the same tonsils are paired (n = 6). Data in (D–F, H) were analyzed by the Mann–Whitney U test. Data in (G) were obtained from three independent experiments.

