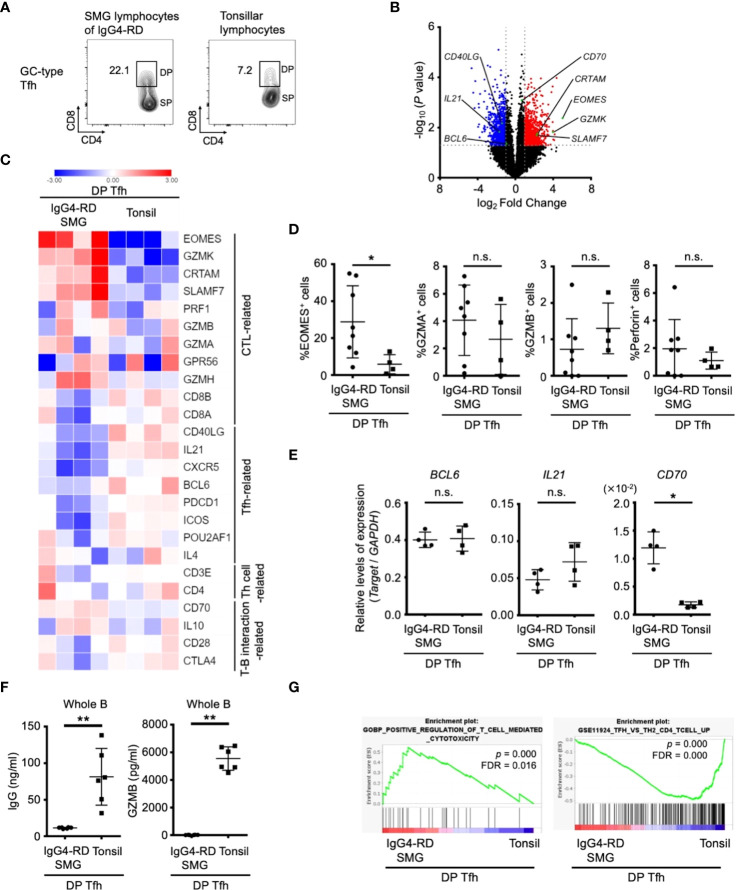
Figure 5.
Features of DP-Tfh cells in inflammatory lesions of IgG4-RD. (A) Representative flow cytometry profiles of DP-Tfh cells and SP-Tfh cells in GC-type Tfh cells in the lymphocytes of tonsils and SMG lesions of IgG4-RD. (B) Volcano plot showing differentially expressed genes (p < 0.05) with more than two-fold expression in DP-Tfh cells localized in SMG lesions of IgG4-RD versus those in tonsils. Red and blue dots indicate the upregulated and downregulated genes, respectively, in the DP-Tfh cells of IgG4-RD. Data were obtained from microarray analysis of four specimens in each experimental group. (C) Heat map representing the relative abundances of transcripts identified in (B) for selected genes involved in the functioning and regulation of helper CD4+ T cells and CTLs. Relative values of gene expression are indicated by color. (D) Expression of CTL-related molecules in DP-Tfh cells of SMG lesions of IgG4-RD (n = 8) and tonsils (n = 4) as assessed by flow cytometry. (E) Relative levels of gene expression in DP-Tfh cells of SMG lesions of IgG4-RD (n = 4) and tonsils (n = 4) as indicated in (B) analyzed by RT-qPCR. GAPDH was used as a control. (F) Lower B-cell helper capacity of DP-Tfh cells in IgG4-RD lesions than in tonsils. The levels of IgG and granzyme B (GZMB) in supernatants from co-cultures of DP-Tfh cells with autologous whole B cells (CD3-CD19+) under stimulation of CD3 and CD28 were analyzed by ELISA on day 7 after initial incubation (IgG4-RD, n = 6; tonsil, n = 6). (G) Gene set enrichment analysis (GSEA) of genes identified in (B) showing transcriptomes of DP-Tfh cells. Results from gene sets associated with cytotoxic T cells or Tfh cells are shown on the left and right, respectively. Data in (D–F) were analyzed by the Mann–Whitney U test.

