Figure 6.
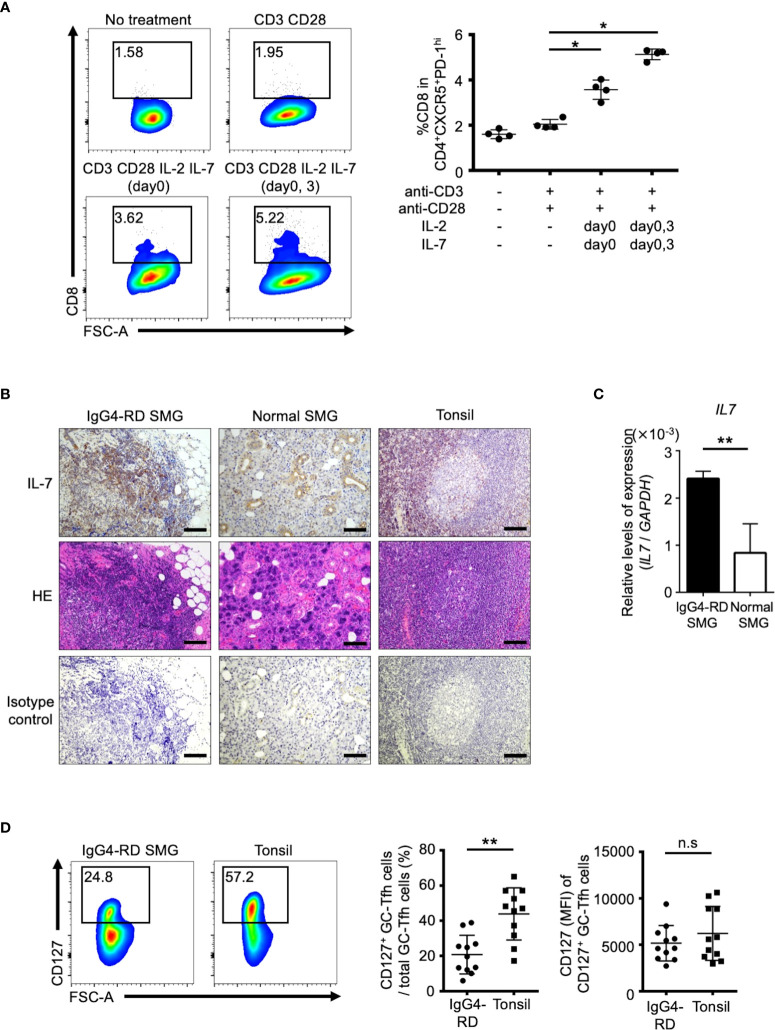
SP-Tfh cells are the possible origin of DP-Tfh cells. (A) Upregulation of CD8 on SP-Tfh cells (CD3+CD4+CD8-CXCR5hiPD-1hi) under the stimulation of IL-2 and IL-7. SP-Tfh cells (5×10⁴ cells/well) from tonsils (n = 4) were incubated in 200 μL of AIM-V medium with or without 2 μg/mL anti-CD3 and 2 μg/mL anti-CD28 mAbs. Under the stimulation of CD3 and CD28, 20 ng/mL IL-2 and 20 ng/mL IL-7 were added once on day 0 or twice on days 0 and 3. On day 7, cells were analyzed by flow cytometry. Representative flow cytometry profiles are shown on the left. Data obtained from four independent experiments are summarized in a graph on the right. (B) Histological examination of IL-7 expression. Immunohistochemistry of IL-7 in SMG lesions of IgG4-RD, normal SMG tissues, and tonsils are shown in the upper panels. The HE-stained images and isotype controls for immunohistochemistry in the corresponding tissue areas are shown in the middle and lower panels, respectively. Scale bar: 100 μm. (C) Relative expression levels of IL-7 in SMG lesions of IgG4-RD (n = 4) and normal SMG (n = 4) assessed by RT-qPCR analysis. GAPDH was used as a control. (D) Representative flow cytometry profiles showing the presence of CD127 on GC-type Tfh cells (CD3+CD4+CXCR5hiPD-1hi) in IgG4-RD lesions of SMGs and tonsils (left). The percentages of CD127+ GC-type Tfh cells among the total GC-type Tfh cells in IgG4-RD lesions and tonsils (right). Values of the mean fluorescence intensity (MFI) of CD127 on GC-type Tfh cells in the two groups are also shown (IgG4-RD, n = 11; tonsil, n = 11). Data in (A, C, D) were analyzed by the Mann–Whitney U test.

