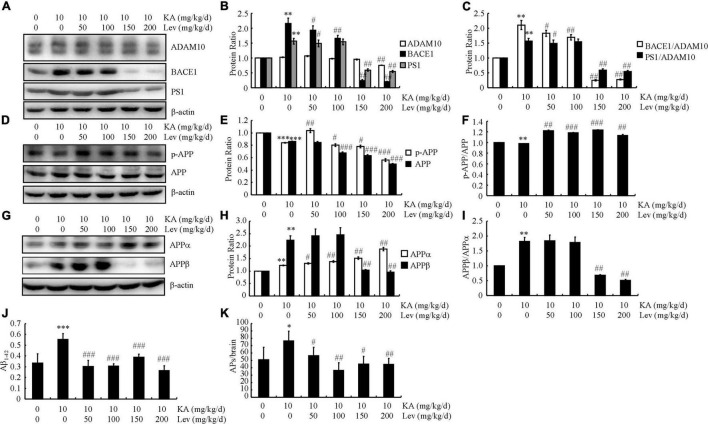
FIGURE 2.
High concentrations of LEV suppress the production and deposition of Aβ in KA-stimulated APP23/MAPT mice. (A–C) Protein levels of ADAM10, BACE1, and PS1 in the brains of KA (10 mg/kg/d)- or LEV (50, 100, 150 or 200 mg/kg) + KA-treated APP23/MAPT mice. (D–F) Protein levels of p-APP and APP in the brains of KA- or LEV (50, 100, 150, or 200 mg/kg) + KA-treated APP23/MAPT mice. (G–I) Protein levels of sAPPα and sAPPβ in the brains of KA- or LEV (50, 100, 150, or 200 mg/kg) + KA-treated APP23/MAPT mice. The optical densities of bands in the western blots were evaluated using the ImageJ software. (J) The production of Aβ1–42, as determined using enzyme-linked immunosorbent assay. (K) The number of SPs. As determined by immunohistochemical staining (*P < 0.05, **P < 0.01, and ***P < 0.001 vs. controls; #P < 0.05; ##P < 0.01, and ###P < 0.001 vs. the KA group; one-way ANOVA). KA, kainic acid; LEV, levetiracetam; SPs, senile plaques; Aβ, amyloid β-peptide.

