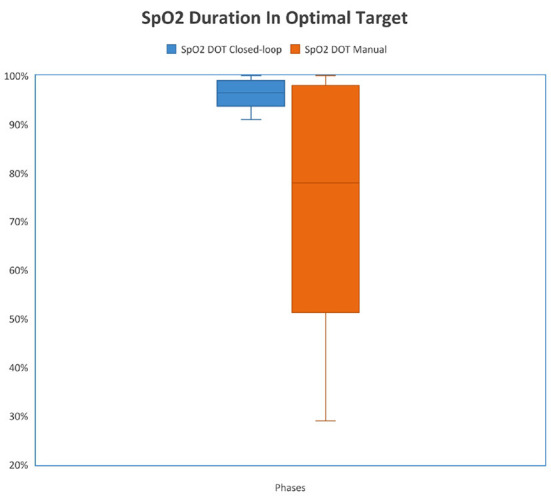
Figure 3.

Comparison of duration in optimal target (DOT) SpO2 between study phases. {The median percentage of time spent in the optimal zone was 96.4% [93.6–98.7 (IQR)] when the FiO2 controller was activated and the median percentage of time spent in the optimal zone was 78.4% [51.4–98 (IQR)] when FiO2 was controlled manually (p < 0.001)}.
