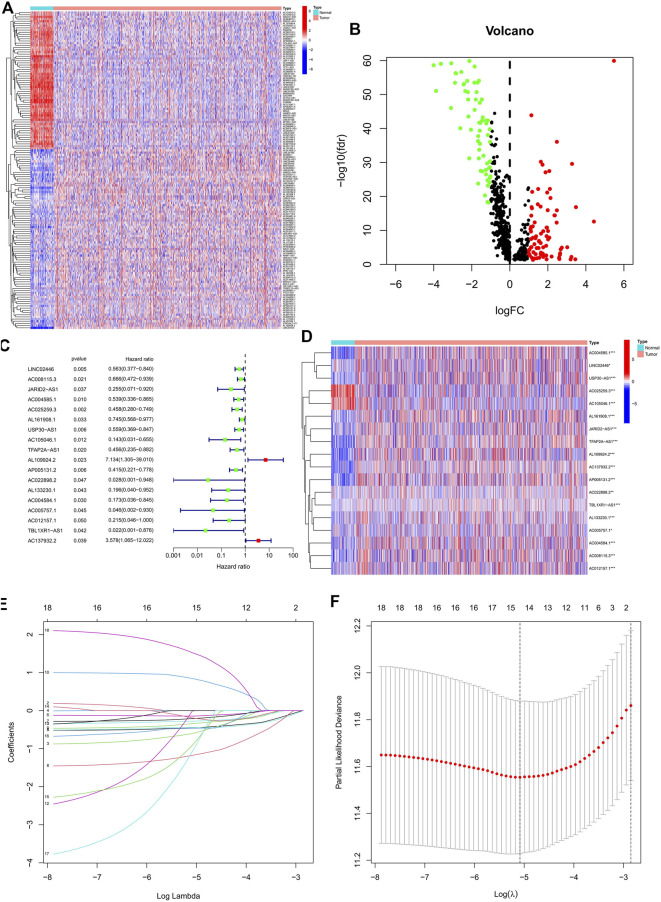
FIGURE 1.
Identification of the prognostic ERS-related lncRNAs for BC patients. (A) Heatmap of 145 differentially expressed lncRNAs. (B) Volcano plot of ERS-related lncRNAs. Red dots indicate upregulated lncRNAs in tumor tissues while the green dots indicate downregulated lncRNAs. (C,D) Forest plot (C) and heatmap (D) of the prognostic ERS-related lncRNAs extracted by the univariate Cox regression analysis. (E,F) LASSO variable trajectory plot for 1,000 cross validations(E) and LASSO coefficient profile (F). ERS, endoplasmic reticulum stress; BC, breast cancer.

