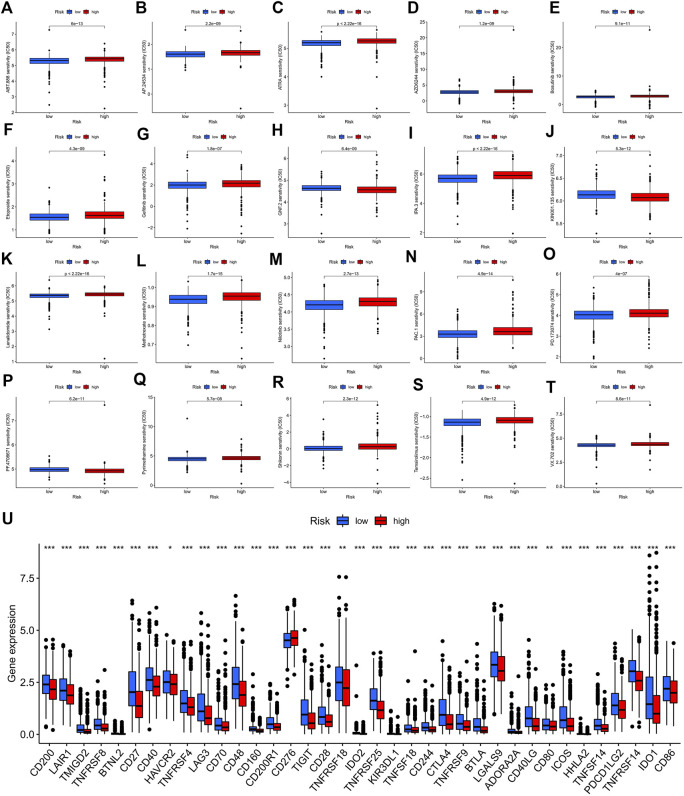
FIGURE 10.
Potential drug sensitivity analysis by IC50 and the immune checkpoint gene expression analysis between the high- and low-risk groups. (A–T) The boxplots for the drug sensitivity analysis of (A) ABT.888. (B) AP.24534. (C) ATRA. (D) AZD6244. (E) Bosutinib. (F) Etoposide. (G) Gefitinib. (H) GNF.2. (I) IPA.3. (J) KIN001.135. (K) Lenalidomide. (L) Methotrexate. (M) Nilotinib. (N) PAC.1. (O) PD.173074. (P) PF.4708671. (Q) Pyrimethamine. (R) Shikonin. (S) Temsirolimus. (T) VX.702. Top 20 significantly associations were displayed, as determined by the p-value. (U) Differential expression analysis of the immune checkpoint genes between the high-risk and low-risk groups. IC50, the half-maximal inhibitory concentration; *, p < 0.05; **, p < 0.01; ***, p < 0.001.

