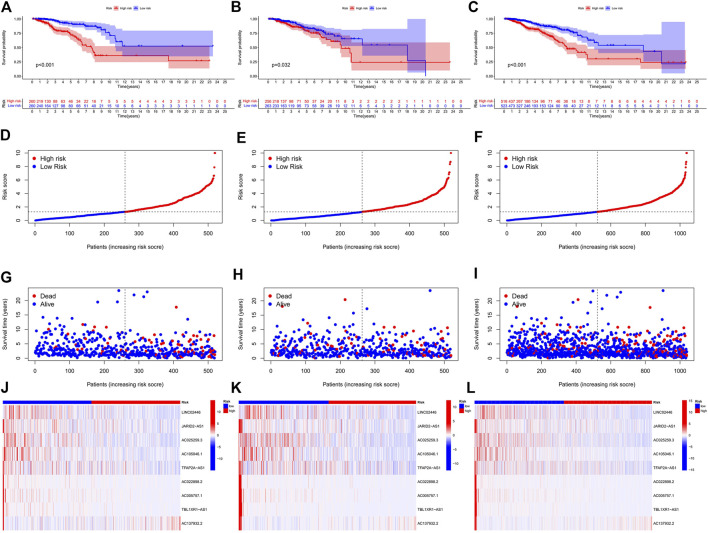
FIGURE 2.
Prognosis and risk scoring analysis of 9 ERS-related lncRNAs in the different sets for BC patients. (A–C) Kaplan–Meier survival curves of BC patients’ OS in the high- and low-risk groups in the training (A), validation (B), and complete sets (C). (D–F) Risk score distribution in the training (D), validation (E), and complete sets (F) for two groups. (G–I) Scatter plots of BC patient survival status distribution in the training (G), validation (H), and complete sets (I). (J–L) Risk heatmaps of the 9 ERS-related lncRNA expression in the training (J), validation (K), and complete sets (L). Red represents high expression and green represents low expression. ERS, endoplasmic reticulum stress; BC, breast cancer; OS, overall survival.

