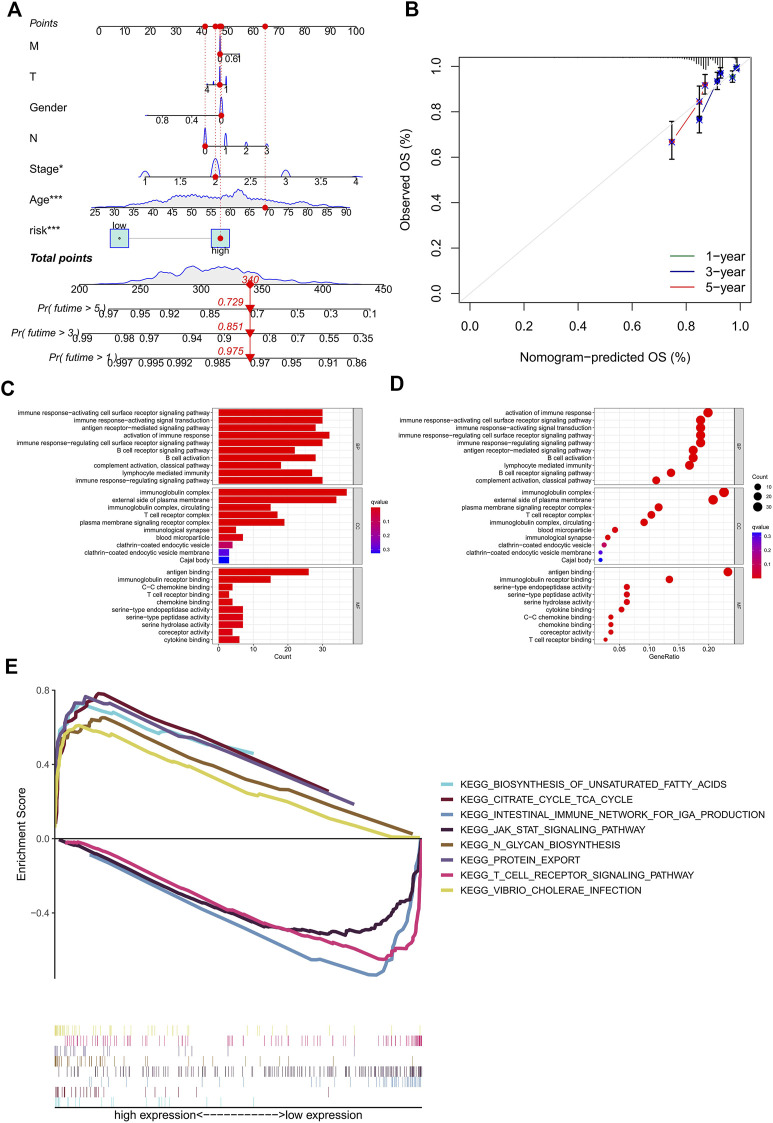
FIGURE 4.
Construction of the nomogram and calibration curves, enrichment analysis of the prognostic signature. (A) nomogram prediction model of the combined risk score and clinicopathological characteristics for 1-, 3-, and 5-year OS rate in BC patients. (B) Calibration curves for the relationship between predicted survival and the observed OS rate at 1, 3, and 5 years (C–D) The GO function enrichment analyses. (E) The GSEA pathway enrichment analyses. OS, overall survival; BC, breast cancer.

