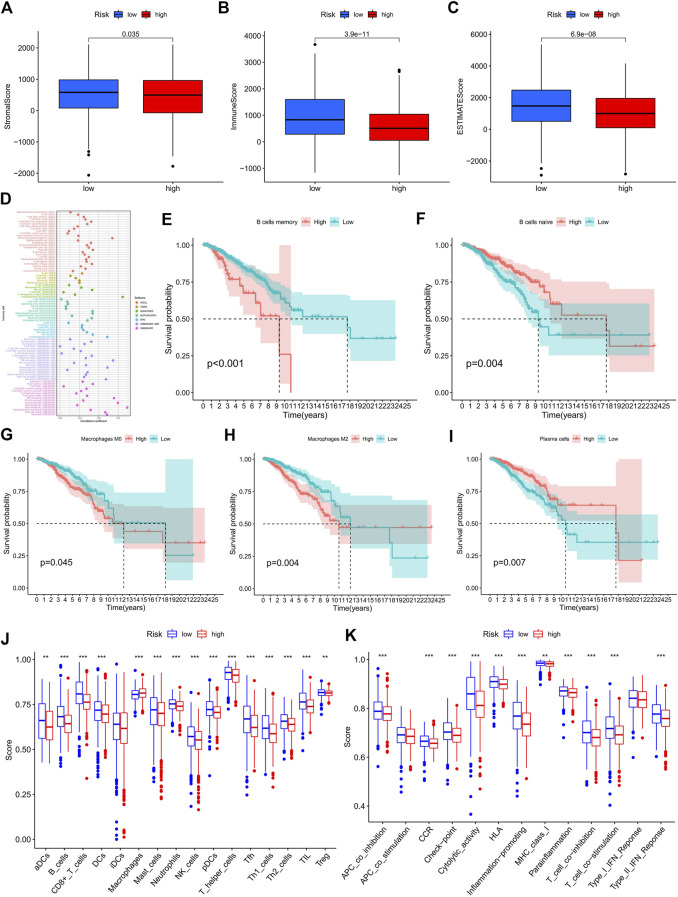
FIGURE 6.
Exploration of the tumor immune status. (A–C) The boxplots for StromalScore (A), ImmuneScore (B), and ESTIMATEScore (C) in the high- and low-risk groups. (D) Estimation of immune-infiltrating cells in BC by using the Spearman correlation analysis. (E–I) Kaplan–Meier survival curves of screened B memory cells (E), B naive cells (F), Macrophages M0 (G), Macrophages M2 (H) , and plasma cells (I) in BC patients. (J–K) The score of the infiltrating immune cells (J) and immune-related functions (K) in the high- and low-risk groups. BC, breast cancer; *, p < 0.05; **, p < 0.01; ***, p < 0.001.

