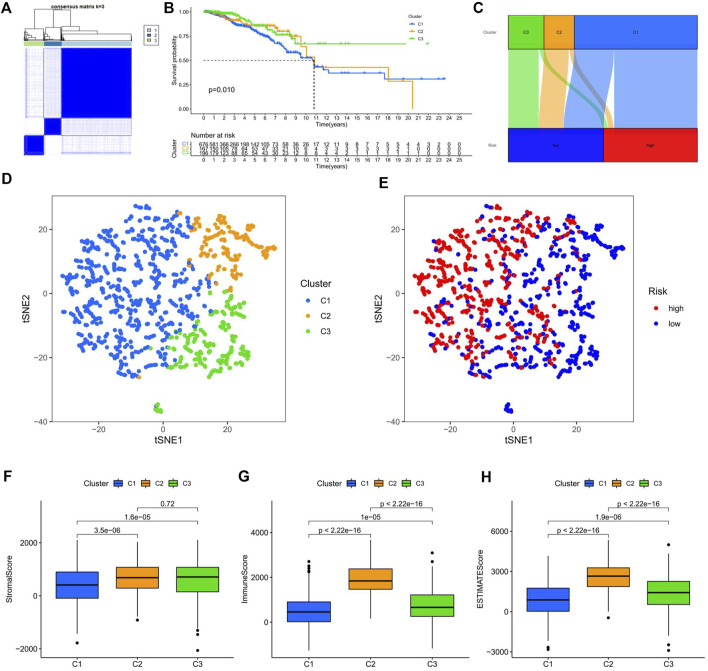
FIGURE 7.
Survival, tSNE, and tumor microenvironment analysis of three distinct subgroups of BC divided by consensus clustering. (A) Consensus matrix with optimal k = 3. (B) Kaplan–Meier survival curves of BC patients’ OS among the three different subgroups. (C) Sankey diagram of the relationship between the three different subgroups and risk score. (D) tSNE analysis among the three different subgroups. (E) tSNE analysis between the high-risk and low-risk groups. (F–H) The boxplots for StromalScore (F), ImmuneScore (G), and ESTIMATEScore (H) among the three different subgroups. tSNE, t-Distributed Stochastic Neighbor Embedding; BC, breast cancer; OS, overall survival.

