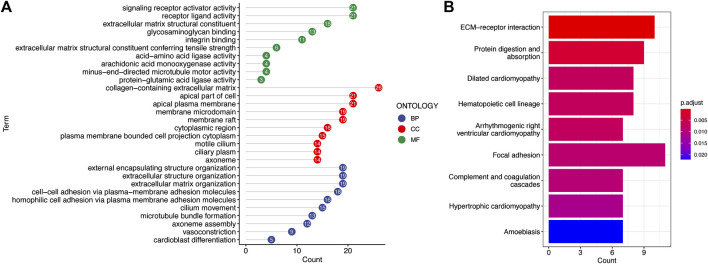
FIGURE 8.
Functional annotation of the low-risk and high-risk groups in TCGA cohort. (A) Most significant GO enrichment. (B) Result of KEGG pathway enrichment based on the differentially expressed genes between the two risk groups (the longer bars indicate that more genes were enriched, and the deepening red indicates that the differences were more apparent).

