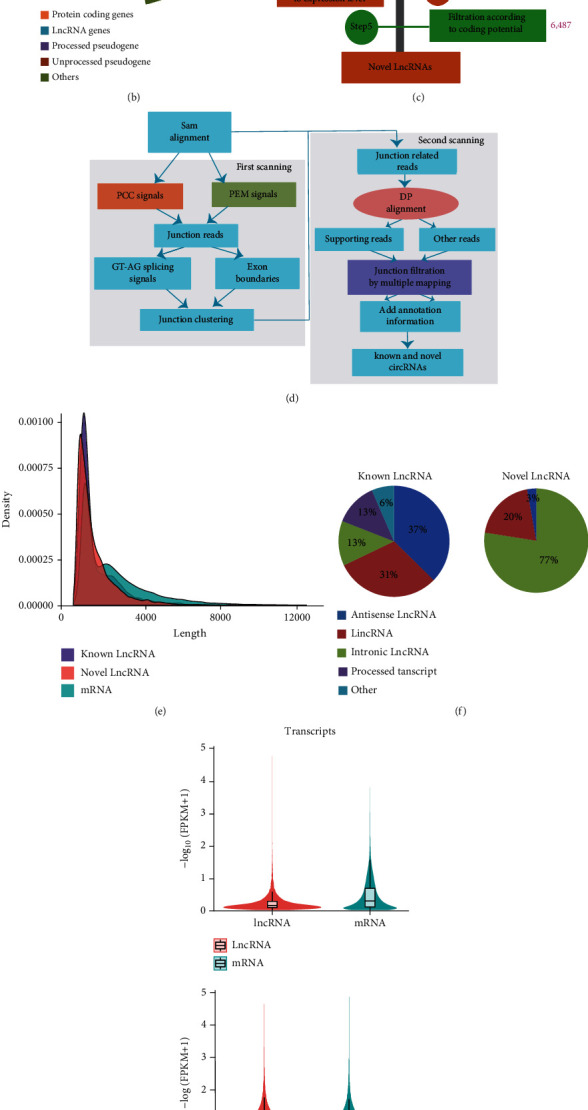
Figure 1.

Distribution of novel and known lncRNAs/circRNAs and DE lncRNAs/circRNAs, mRNAs. (a) Sample correlation; (b) transcript classes; and (c) in silico pipeline used for the identification of novel lncRNAs. The purple number next to the bar is the remaining count of lncRNAs after filtering each step; (d) bioinformatics pipeline used for the identification of circRNAs; (e) FPKM density of all transcripts; (f) composition of known and novel lncRNAs; (g) violin plot of transcripts between lncRNA and mRNA and group LTCs and group LSCs; (h) counts of lncRNA and circRNA; (i) composition of circRNAs; and (j) Venn diagram showing predicted circRNAs in LTCs and LSCs, respectively.
