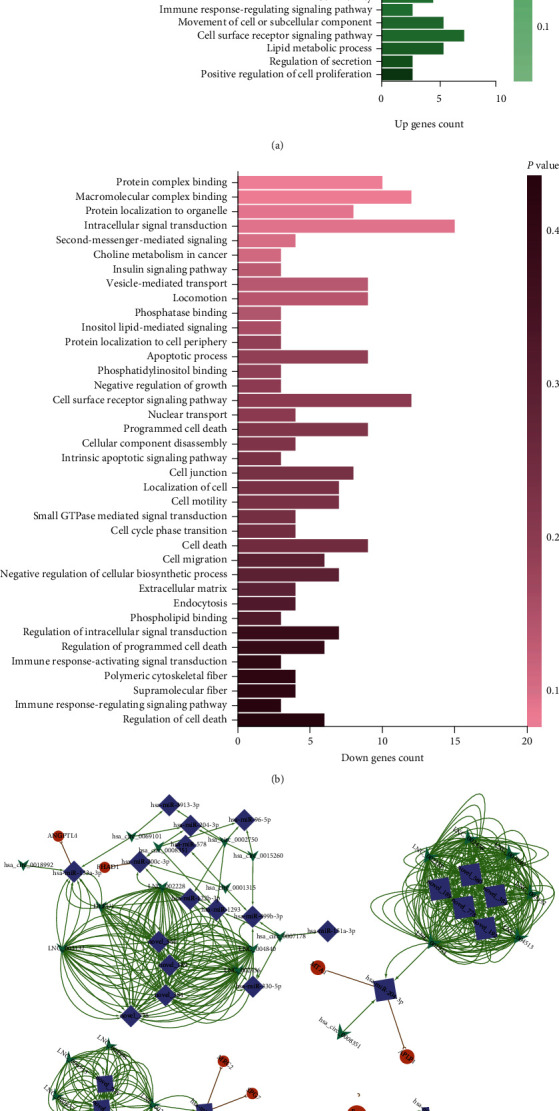
Figure 5.

GO analysis and MCODE analysis. (a) GO analysis of upregulated gene sets comprising the ceRNA networks; (b) GO analysis of downregulated gene sets comprising the ceRNA networks; (c) Four main subnetworks; (d) Heatmap of 11 transcripts in the four subnetworks.
