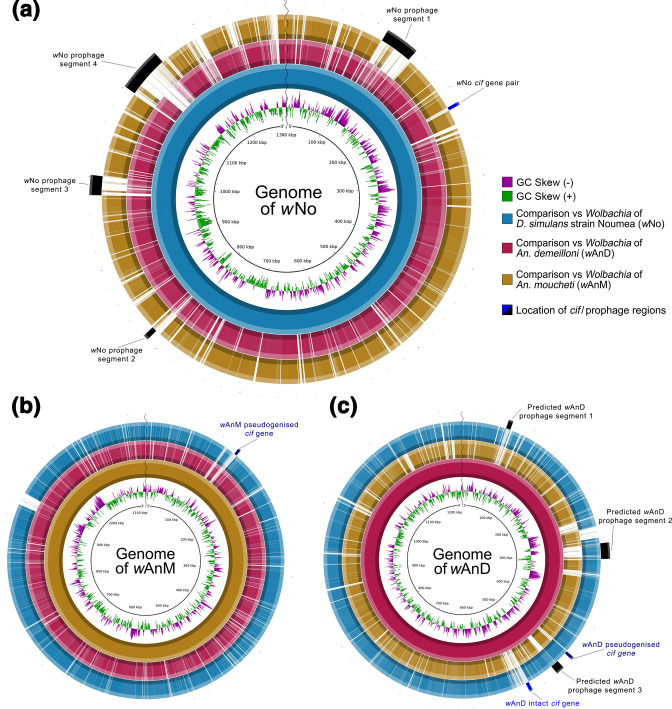
Fig. 4.
BLAST Ring Image Generator (BRIG) visualization of prophage regions in the genomes of wNo, wAnM and wAnD when compared to one another. Each individual ring represents the presence or absence of similarity for a specific genome (represented by the different colours, see the key on the right of a) against a template genome (represented by the innermost solid colour ring, and the name at the centre of the panel). Presence of similarity is defined as the query genome (the ring) having greater than 50 % similarity to the template genome. The outermost ring for each figure part contains information on predicted prophage and cif gene localizations. (a) Comparison of wAnM and wAnD against a wNo template genome (1 301 823 bp in length). Note how the black bars representing predicted prophage regions as described by Ellegaard et al. [91] overlap areas with no similarity against the wAnM genome, whilst having some similarity to the wAnD genome. Also, note how its single, intact cif gene pair is located separately from previously predicted prophage regions. (b) Comparison against a wAnM template genome (1 121 812 bp in length). Note how this genome was reported to contain no prophage regions, and its single pseudogenized cif gene pair is located in an area with no similarity to both wNo and wAnD. (c) Comparison against a wAnD template genome (1 231 247 bp in length). Predicted prophage segments 1 and 2 were predicted by the phaster web server, with segment 3 predicted by blastx searches against the prophage regions WOVitA1 and WOCauB1 through to B3, as identified by Bordentstein et al. [90]. Note how of the three predicted prophage regions, two showed similarity to the wNo genome, and one showed no similarity to either genome. Also, note how its two cif gene pairs are located separate from, but close to, predicted prophage segment 3. In addition, note how the intact cif gene pair appears within a region that shows weak to no similarity against both wAnM and wNo.

