Figure 1.

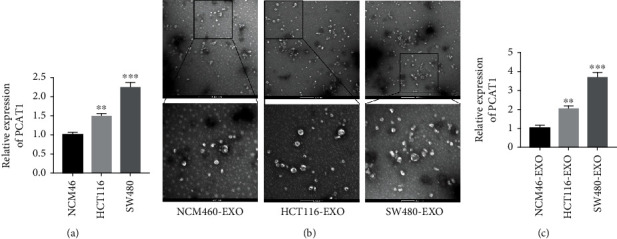
Expression of PCAT1 in colorectal cancer cells and their exosomes. (a) RT-qPCR was used to detect the expression of PCAT1 in HCT116 and SW480 cells. ∗∗P < 0.01, ∗∗∗P < 0.001vs NCM46. (b) The shape and size of exosomes were observed by transmission electron microscopy. (c) RT-qPCR detected the expression of PCAT1 in the exosomes. ∗∗P < 0.01, ∗∗∗P < 0.001vs NCM46-EXO.
