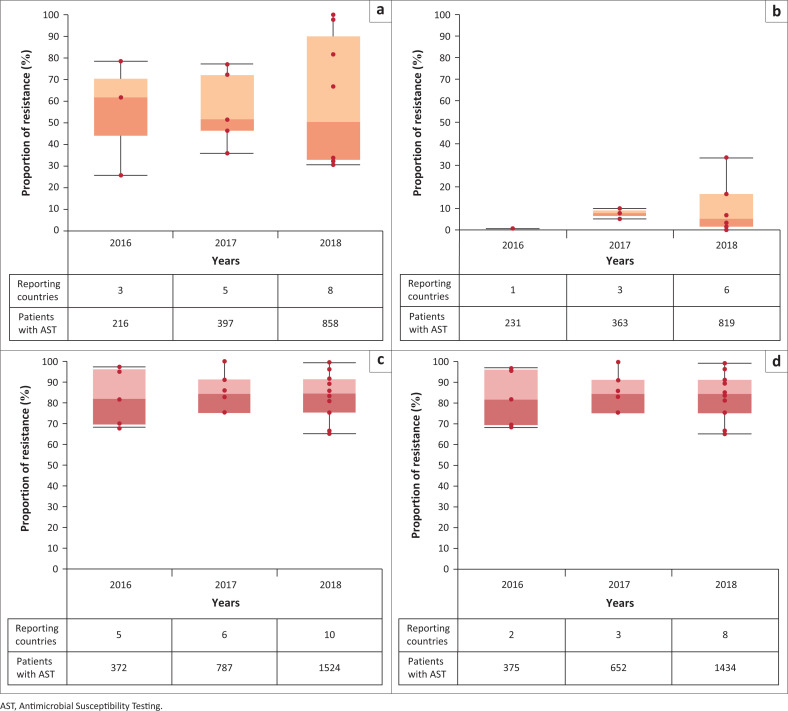
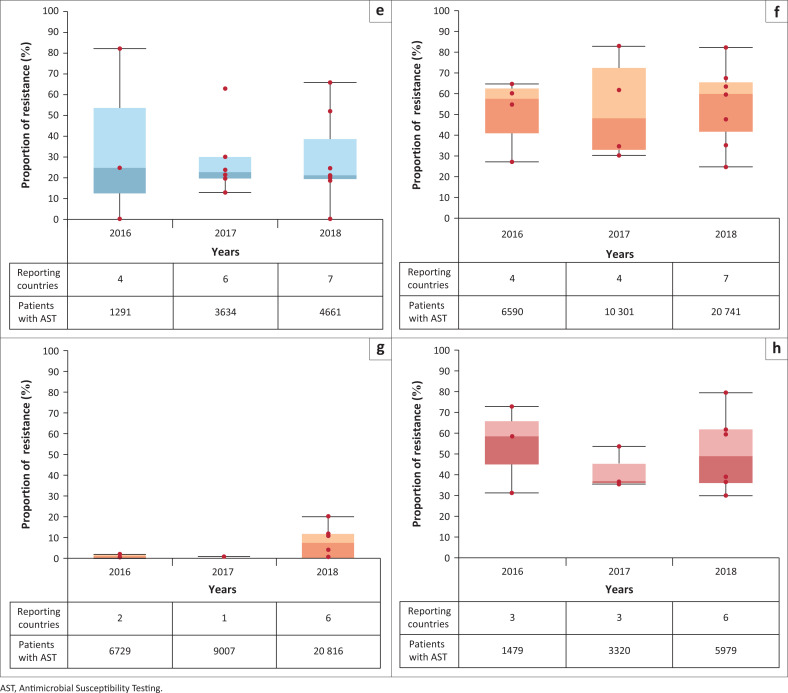
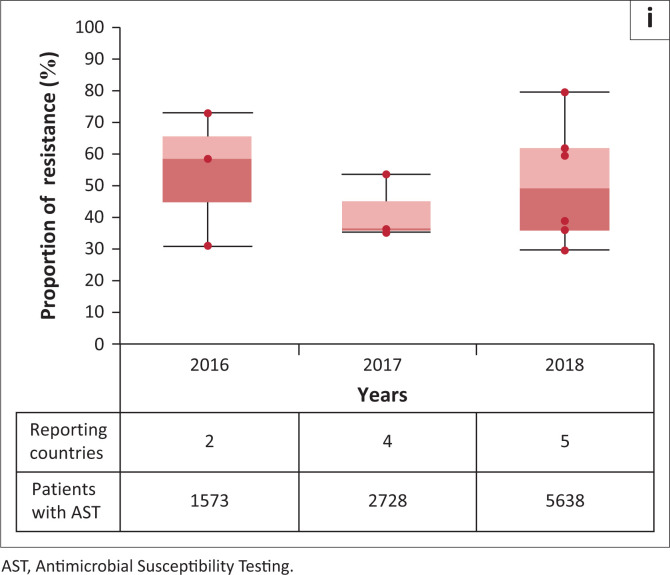
FIGURE 1.
Boxplots showing proportion (median) of infection syndrome due to bacteria resistant to selected antibiotics in Egypt, Ethiopia, Madagascar, Malawi, Mali, Mozambique, Nigeria, South Africa, Sudan, Tunisia, Uganda, and Zambia between 2016 and 2018. The number of countries reporting for each year and the number of patients with Antimicrobial Susceptibility Testing (AST) results are shown in the x-axis. The list and the number of countries reporting each year may vary. Each red dot corresponds to a single country result. (a) Boxplots showing proportion (median) of bloodstream infections due to Escherichia coli resistance to third-generation cephalosporins in Egypt, Ethiopia, Madagascar, Malawi, Mali, Mozambique, Nigeria, South Africa, Sudan, Tunisia, Uganda and Zambia between 2016 and 2018. The number of countries reporting for each year and the number of patients with AST results are shown below the x-axis. The list and the number of countries reporting each year may vary. Each red dot corresponds to a single country result. (b) Boxplots showing proportion (median) of bloodstream infections due to Escherichia coli resistance to carbapenems in Egypt, Ethiopia, Madagascar, Malawi, Mali, Mozambique, Nigeria, South Africa, Sudan, Tunisia, Uganda and Zambia between 2016 and 2018. The number of countries reporting for each year and the number of patients with AST results are shown below the x-axis. The list and the number of countries reporting each year may vary. Each red dot corresponds to a single country result. (c) Boxplots showing proportion (median) of bloodstream infections due to Klebsiella pneumoniae resistance to third-generation cephalosporins, in Egypt, Ethiopia, Madagascar, Malawi, Mali, Mozambique, Nigeria, South Africa, Sudan, Tunisia, Uganda and Zambia, between 2016 and 2019. The number of countries reporting for each year and the number of patients with AST results are shown below the x-axis. The list and the number of countries reporting each year may vary. Each red dot corresponds to a single country result. (d) Boxplots showing proportion (median) of bloodstream infections due to Klebsiella pneumoniae resistance to carbapenes in Egypt, Ethiopia, Madagascar, Malawi, Mali, Mozambique, Nigeria, South Africa, Sudan, Tunisia, Uganda and Zambia, between 2016 and 2019. The number of countries reporting for each year and the number of patients with AST results are shown below the x-axis. The list and the number of countries reporting each year may vary. Each red dot corresponds to a single country result. (e) Boxplots showing proportion (median) of bloodstream infections due to methicillin-resistant Staphylococcus aureus (MRSA) in Egypt, Ethiopia, Madagascar, Malawi, Mali, Mozambique, Nigeria, South Africa, Sudan, Tunisia, Uganda and Zambia, between 2016 and 2019. The number of countries reporting for each year and the number of patients with AST results are shown below the x-axis. The list and the number of countries reporting each year may vary. Each red dot corresponds to a single country result. (f) Boxplots showing proportion (median) of urinary tract infections due to Escherichia coli resistance to ciprofoloxacin in Egypt, Ethiopia, Madagascar, Malawi, Mali, Mozambique, Nigeria, South Africa, Sudan, Tunisia, Uganda and Zambia between 2016 and 2019. The number of countries reporting for each year and the number of patients with AST results are shown below the x-axis. The list and the number of countries reporting each year may vary. Each red dot corresponds to a single country result. (g) Boxplots showing proportion (median) of urinary tract infections due to Escherichia coli resistance to carbapenems in Egypt, Ethiopia, Madagascar, Malawi, Mali, Mozambique, Nigeria, South Africa, Sudan, Tunisia, Uganda and Zambia between 2016 and 2019. The number of countries reporting for each year and the number of patients with AST results are shown below the x-axis. The list and the number of countries reporting each year may vary. Each red dot corresponds to a single country result. (h) Boxplots showing proportion (median) of urinary tract infections due to Klebsiella pneumoniae resistance to ciprofloxacin in Egypt, Ethiopia, Madagascar, Malawi, Mali, Mozambique, Nigeria, South Africa, Sudan, Tunisia, Uganda and Zambia between 2016 and 2019. The number of countries reporting for each year and the number of patients with AST results are shown below the x-axis. The list and the number of countries reporting each year may vary. Each red dot corresponds to a single country result. (i) Boxplots showing proportion (median) of urinary tract infections due to Klebsiella pneumoniae resistance to carbapenems in Egypt, Ethiopia, Madagascar, Malawi, Mali, Mozambique, Nigeria, South Africa, Sudan, Tunisia, Uganda and Zambia between 2016 and 2019. The number of countries reporting for each year and the number of patients with AST results are shown below the x-axis. The list and the number of countries reporting each year may vary. Each red dot corresponds to a single country result.


