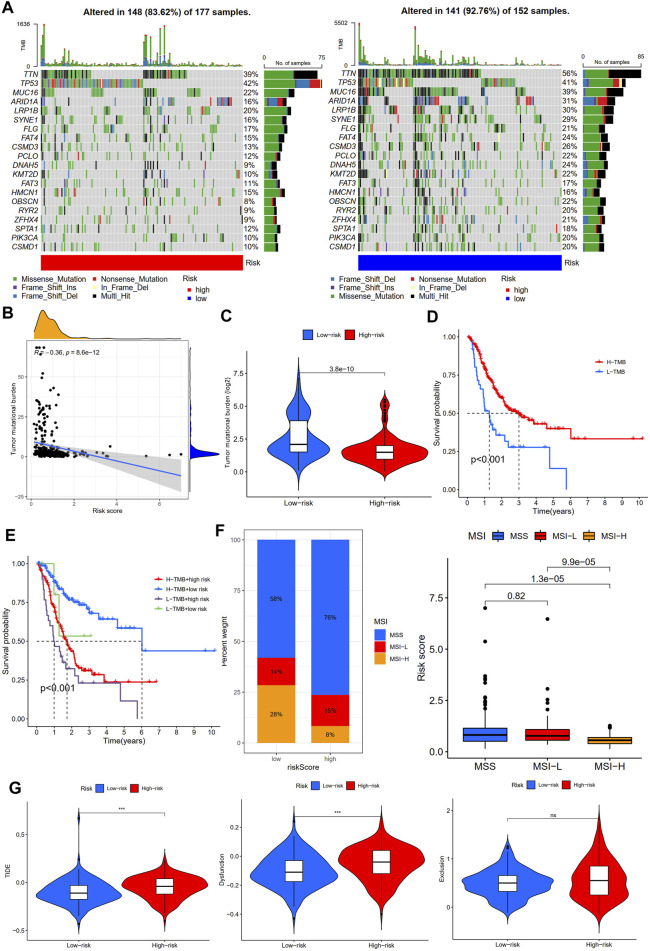
FIGURE 10.
Immunotherapy response analysis between high- and low-risk groups. (A) Mutation profile of STAD patients in high- and low-risk groups. (B) Correlation analysis of TMB and risk scores. (C) Tumor mutation burden analysis between high- and low-risk groups. (D) Survival analysis between high- and low-tumor mutation burden (TMB) in STAD patients. (E) Survival analysis based on tumor mutation burden status and the risk score. (F) Microsatellite instability (MSI) analysis of STAD patients in high- and low-risk groups. (G) TIDE, dysfunction, and exclusion scores between high- and low-risk groups.

